References:
Probably the best introduction to the subject is:
JR Levick (2000) An Introduction to Cardiovascular Physiology. Arnold, London.Probably the most complete text on the subject of arterial haemodynamics is:
WW Nichols & MF O'Rourke (1998) McDonald's Blood Flow in Arteries: Theoretical, Experimental and Clinical Principles (4th Edition). Edward Arnold, London.An excellent text covering much of the same ground is:
WR Milnor (1982) Hemodynamics (2nd Edition). Williams & Wilkins, Baltimore.
Model Question
The heart is a pump, the arteries are pipes, therefore
cariologists and cardiovascular surgeons are
plumbers. Discuss.
The mechanics of flow: An approximate calculation
According to Newton's 2nd law
F = ma
Rearranging for a tube of cross section A,
Assume that a pressure difference of 1 mmHg is applied to blood over a distance of 1 cm.
1 mmHg = 133.3 Pa
1 cm = 0.01 m
r (blood) = 1050 kg/m^2
Thus
That is, this pressure gradient causes an acceleration greater than the acceleration due to gravity which is, in fact, similar to the peak acceleration measured in arterial flow during early systole. It is the pressure gradient, not the pressure which cause flow in an artery.
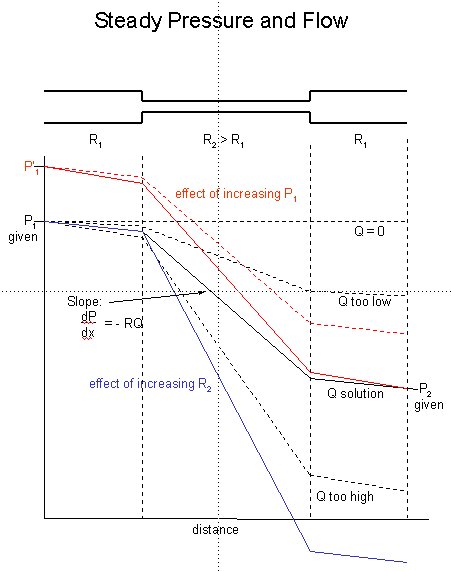
Calculation of steady pressure and flow in a flow
Consider the very simple case of a tube with a narrow section in the centre with resistance R2 > R1. The pressure at the inlet P1 and outlet P2 are fixed and given. We further assume that the flow is simple so that the gradient of pressure at every point in the tube is equal to the resistance R times the volume flow rate Q. We will start at the inlet at the specified pressure P1.
If we increase the inlet pressure, we get the red curves. The flow rate that was the solution for the 'black' conditions, shown by the dotted red curve, no longer satisfies the outlet condition. A higher flow, shown by the solid red curve, does lead to pressure distribution satisfying both the inlet and outlet conditions.
Finally, we consider the case of an increased resistance in the central section of the tube, shown by the blue line. If we keep the flow rate that was the solution to the black conditions, the gradient in the larger parts of the tube are the same but in the centre section it is larger and so this flow rate is no longer the solution. There will be smaller flow rate, not shown, which will again satisfiy the imposed pressure conditions at both the inlet and outlet.
The distribution of mean pressure and resistance in the circulation (adapted from Nichols & O'Rourke)
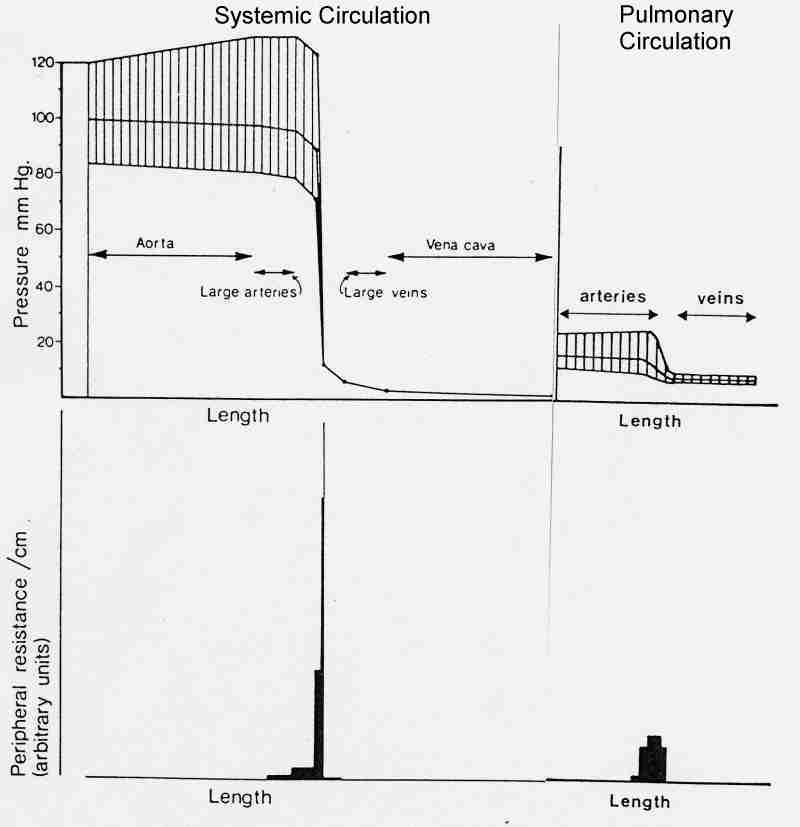
Note that there is very little drop in the mean pressure in the large arteries. Almost all of the resistance is found in the microcirculation (particularly the arterioles) and so almost all of the decrease in mean pressure occurs there.
Pressure waveforms in the systemic arteries (from Nichols & O'Rourke)
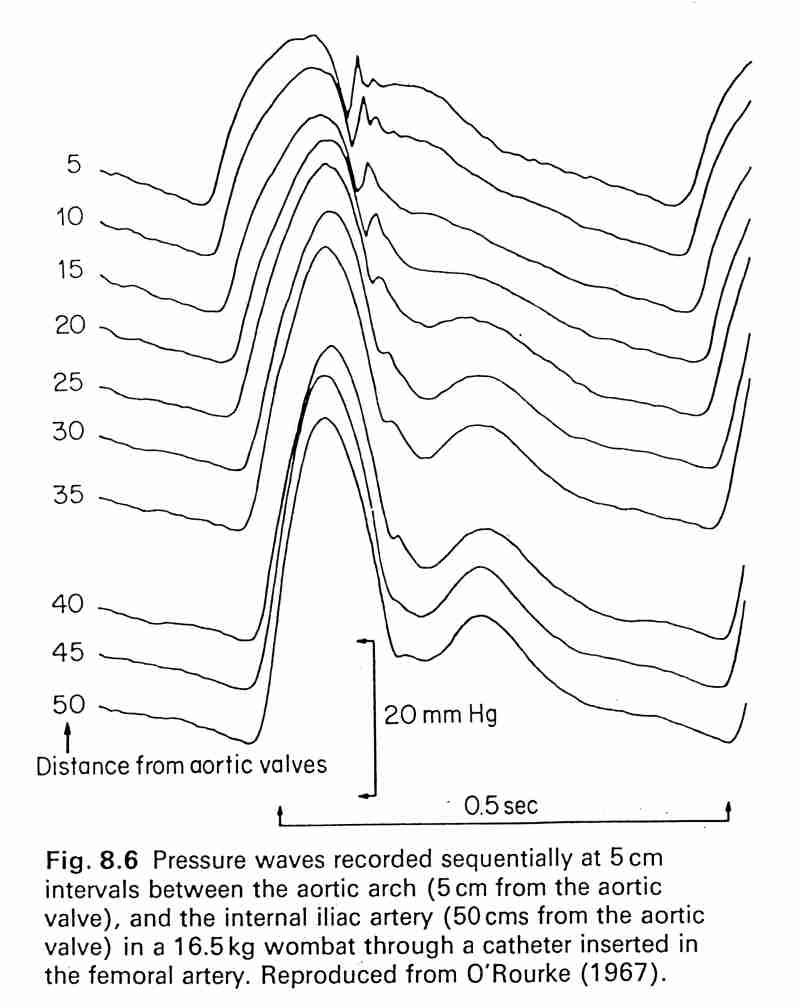
Note that the shape of the pressure pulse changes significantly as it propagates through the aorta. Althought the mean pressure decreases slightly (see previous figure) the pulse pressure (systolic pressure - diastolic pressure) increases distally so that the peak pressure actually increases as the wave propagates.
Pressure and velocity waveforms at different sites in the arteries (from Nichols & O'Rourke)
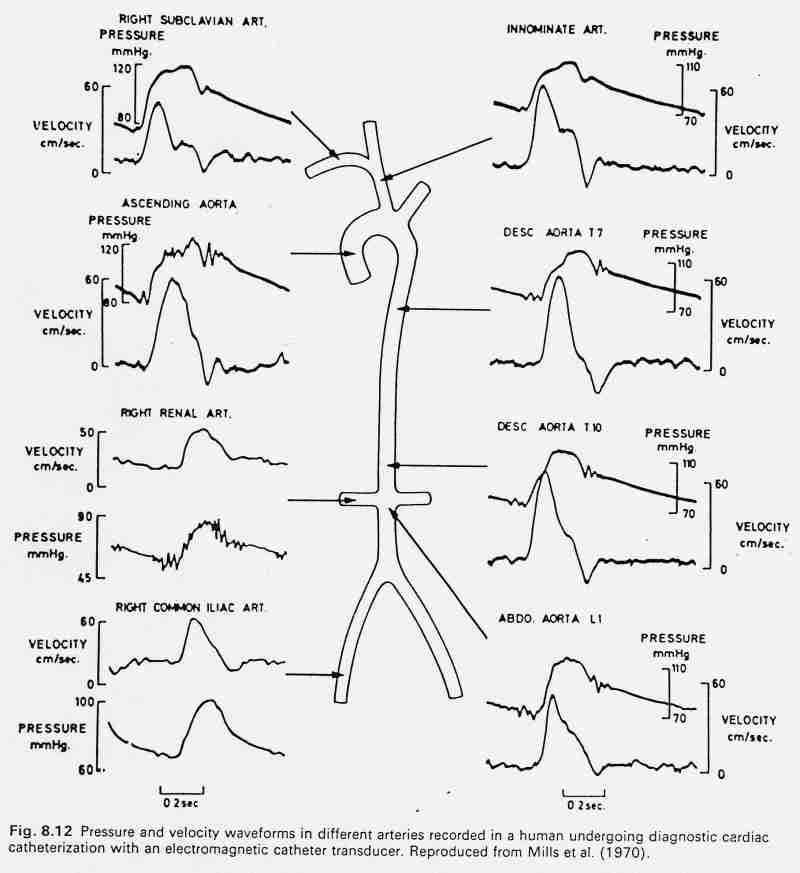
The pressure and velocity waveforms differ markedly at different sites in the large arteries. Note that the peak velocity occurs before the peak in pressure at all sites. This is evidence that there are reflected waves in the arteries, otherwise the pressure and velocity waveforms would be similar in shape (see the water hammer equation below).
Pharmacological effects on pressure and flow waveforms
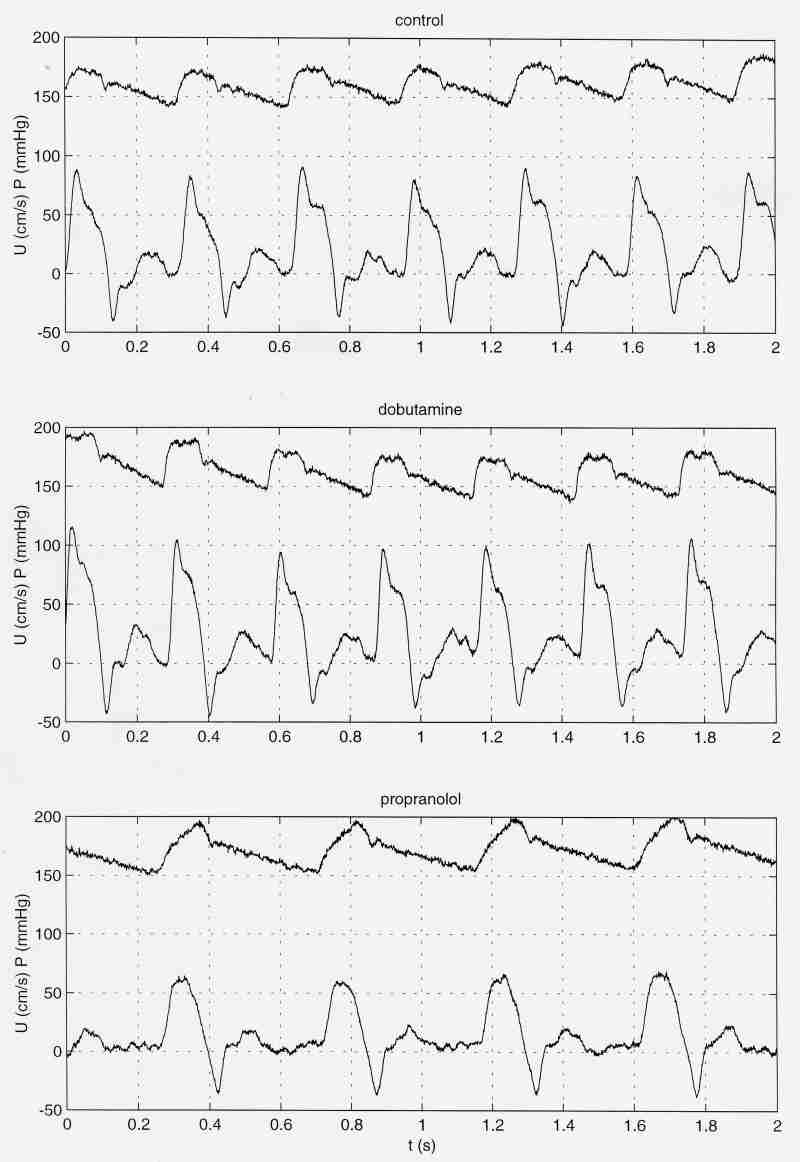
The cardiovascular system can change in many different ways in response to different stimuli. These results were obtained in the dog. The control measurements were taken during anaesthesia with ventilation. Then a bolus of dobutamine was administered and the measurements repeated. After the effects of dobutamine had cleared, propranolol was administered by infustion and the measurements repeated.
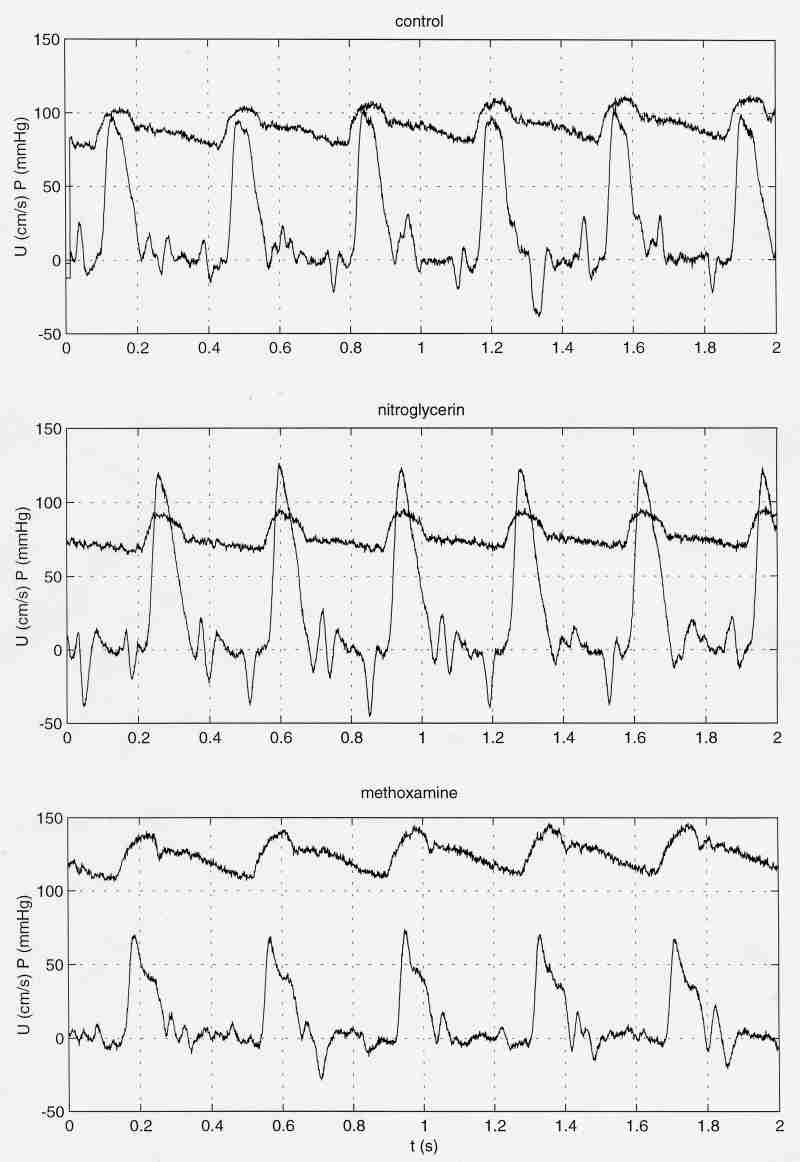
A similar experiment in another dog. After control measurements, a bolus of nitroglycerin was administered and the pressure and flow measured. After the effects of nitroglycerin had cleared, methoxamine was infused and the measurements repeated. Note the changes in heart rate, mean pressure, pulse pressure and pressure and velocity waveforms in general.
The Windkessel
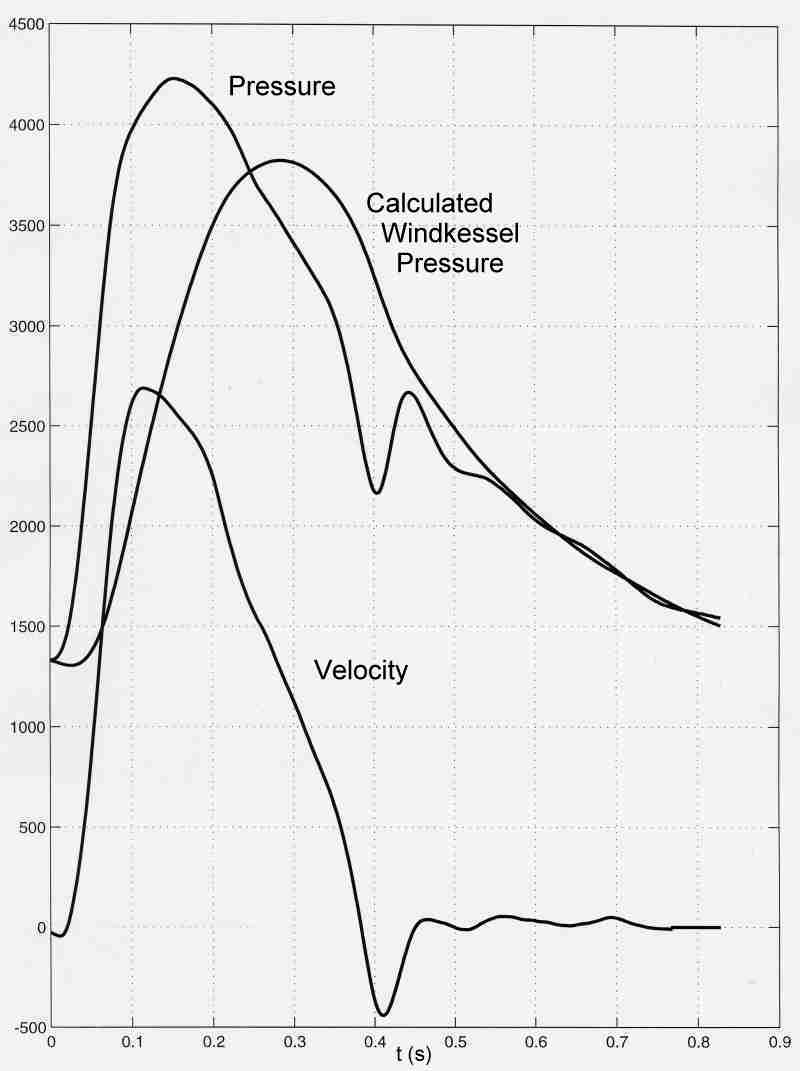
The Windkessel pressure (in Pa) calculated from measured pressure and velocity in the pulmonary artery of a dog. The compliance of the arteries and the resistance of the microcirculation were chosen to match the measured pressure during diastole when flow into the arterial system is zero.
Waves:
When we think of waves, we usually think of sinusoidal wavetrains

(apologies to Hokusai)
However, there are other types of waves, for example discrete wavefronts such as the Severn Bore, and it may be convenient to consider arterial waves this way.
The Severn Bore (for more information see <http:\\www.severn-bore.co.uk>)

click here for a short video of the Severn bore (borvid2.avi - 1045Kb)
(Pity the surfer who fell over as the wave arrived. Unlike ocean surfing, he/she will have to wait 12 hours for the next wave.)
These waves are P-U waves - you cannot have a change in P (the potential energy) without a change in U (the kinetic energy). The relationship between the change in pressure and the change in velocity across the wave is given by the water hammer equation