What would the cardiologist like to measure?
The heart is a pump whose function is to produce blood flow (m3/s) and pressure (Pa). When something goes wrong, it could also be useful to know how different bits of the heart are functioning.
What can the cardiologist measure?
Historically:
1. Pulse
3. Electrocardiogram (ECG)
4. Pressure
Pressure is absolute in that there is a zero pressure (no force / unit area)
however, it is very difficult to measure pressure absolutely and so almost all pressure measurements are relative to some reference pressure (e.g. atmospheric pressure).
Fluid filled catheters are commonly used to measure mean pressure in the different chambers of the heart. Because of viscous damping in the catheter, these measurements provide an 'over damped' measure of the instantaneous pressure waveform. The pressure transduction takes place outside of the body and therefore the transducer can be more robust and free from errors such as temperature sensitivity and drift.
For more accurate measurements of instantaneous pressures,
pressure transducers, generally strain gauges or piezoelectric elements, are
mounted at the tip of the catheter. These transducers must be calibrated
frequently, generally by measuring a known steady pressure prior to and after
insertion of the catheter into the heart.
For higher temporal resolution, it is necessary to use B-mode scanning for position information and either continuous wave or range gated Doppler scanning along a single beam direction. These types of scanning can produce temporal resolution of less than 1 ms.
6. Magnetic Resonance (MR)
Some specific problems in ultrasound measurements in the heart:
1) Resolution
The wavelength of an ultrasound wave depends upon the frequency produced by the transducer and the speed of sound in the tissue. Because higher frequency sound waves dissipate more quickly due to viscous and viscoelastic effects, the maximum frequency is limited by the distance to the target. For transthoracic scans, the maximum frequency is generally 3.5 MHz. For transoesophogeal scans the distance to the heart is smaller and 5 MHz transducers are commonly used.
wavelength = (speed of sound)/frequency
The speed of sound in tissue is approximately 1500 m/s (the speed of sound in water). Therefore, for a 5 MHz transducer the
wavelength = (1500)/(2p 5x10⁶) ~ 50 mm
The absolute, ideal resolution attainable is 1/2 a wavelength and so the ultimate resolution for a 5 MHz probe is > 25 mm.
This means that it is impossible to make accurate measurements of features such as heart valve thicknesses or the intimal thickness of blood vessels, despite the claims of some researchers.
2) Diffraction
Different tissues have different wavespeeds which means that as the beam traverses different tissues it will be diffracted. (The fish in the aquarium is not where it appears to be for the same reason.) In an abdominal scan, it is estimated that the difference between apparent and actual position can be as much as 3 cm. How is it possible to do lumbar punctures under ultrasonic guidance?
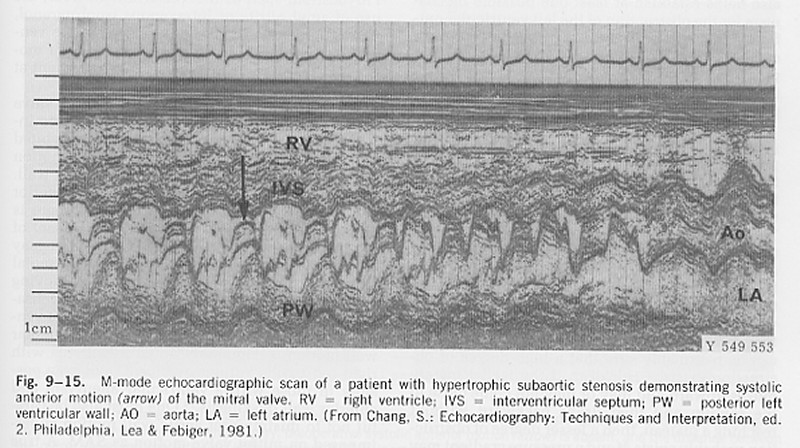
3) Systolic Anterior Motion (SAM) in hypertrophic cardiomyopathy
SAM is the acronym for the anterior movement of the anterior leaflet of the mitral valve during systole. It is thought that this can lead to obstruction of the left ventricular outflow tract by the anterior leaflet and when it is observed in patients with hypertrophic cardiomyopathy it is often taken as an indication for intervention.
Because the whole heart is moving, it is not anterior motion relative to the transducer, but anterior motion relative to the endocardium that should be measured. In this text book example, note the movement of the valve leaflet (arrow) and the simultaneous movement of the posterior left ventricular wall (PV). This is often overlooked in cardiac scans.
4) Filling of the left ventricle (LV)
It is relatively easy to measure the velocity of blood flow through the mitral valve using range gated Doppler ultrasound.
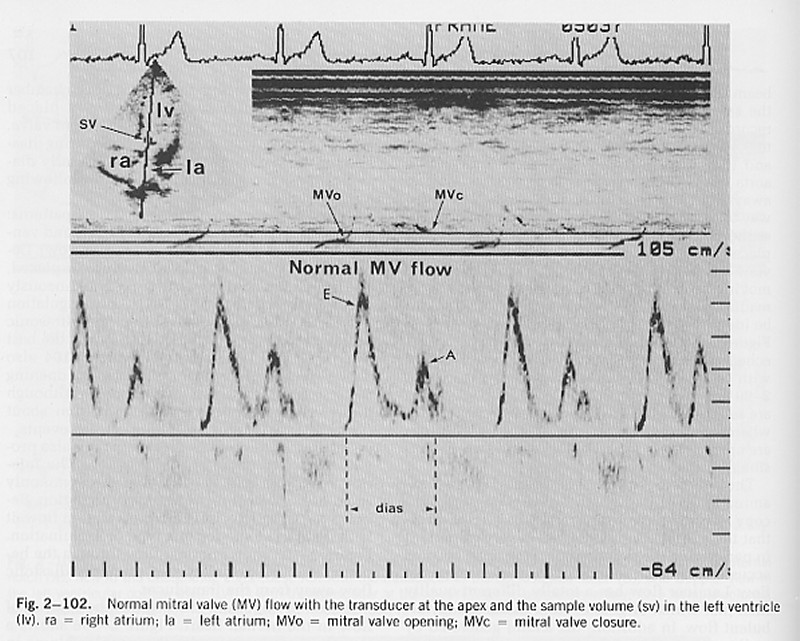
In the normal heart at rest, two separate periods of blood flow through the mitral valve are seen: the 'E wave' which occurs soon after closure of the aortic valve and the 'A wave' which is the result of atrial contraction (note the timing of the A wave relative to the P wave on the ECG). It is often assumed that the net flow into the ventricle can be calculated by integrating the measured velocity times the area of the mitral valve ring. This is wrong!
The velocity is the velocity relative to the transducer which is fixed to the chest wall. As the atrium contracts, the mitral valve moves towards the apex. Thus, blood which is initially in the atrium can find itself in the ventricle not because it has moved relative to the transducer, but because the left ventricle has moved.
This is similar to the mechanism of the old fashioned hand operated pump. In the well is a cylinder with a hinged plate at the bottom. As the handle is raised, the cylinder descends into the well water and the hinged plate swings open admitting water into the cylinder. When the handle is lowered, the cylinder moves upward, the hinged plate closes and the water is elevated. The cylinder is filled by moving it relative to the water in the well which is stationary relative to the surface.
5) The Modified Bernoulli Equation
Virtually every text book on echocardiography cites the modified Bernoulli equation for calculating the pressure difference (usually incorrectly called the 'pressure gradient') between two chambers of the heart when it is possible to measure the velocity of a jet between them using Dopple ultrasound. (Most heart valves permit a little bit of 'functional' regurgitation.)
DP = 4 V2
where (the better books add) P is measured in mmHg and V is measured in m/s2.
Think about the meaning of this equation in terms of dimensions.
The 'proper' Bernoulli equation is an energy equation for steady, non-dissipative flows. It says that along a stream line the total pressure, defined as the sum of the hydrostatic pressure (the potential energy) and the dynamic pressure (the kinetic energy) is constant.
P + 1/2rV2 = PTot
If we consider two points along the stream line: 1) in a region with a large cross section and hence low velocity (say the LV) and 2) in a high velocity jet (say a jet of mitral regurgitation).
P1 + 1/2rV12 = P2 + 1/2rV22 = PTot
If V1 ~ 0, then this equation can be rearranged to give DP = P1- P2 (writing V = V2)
DP = 1/2rV2
The density of blood is approximately 1050 kg/m3, and a pressure of 1 mmHg = 133.3 Pa. Substituting this into the Bernoulli equation
DP (mmHg) = 1/2 1050/133.3 V2 = 3.98 V2
The modified Bernoulli equation is simply using the fact that the density of blood measured in units of mmHg s2/m2 is approximately 8. That is, the '4' in the modified Bernoulli equation has dimensions. Should this sort of thing be encouraged?
6) Proximal Isovelocity Surface Area (PISA) measurement of volume flow rate
Jet velocities (U) are very easy to measure by Doppler ultrasound but jet areas (A) are very difficult to measure accurately. As a result, it is difficult to measure the volume flow rate (Q=UA) in a jet accurately.
PISA is a recent idea to get around this problem by looking not at the jet but the flow in the chamber where the jet is formed. It is based on the ideal solution for inviscid, steady flow in a semi-infinite reservoir flowing through a small hole at the origin (flow into a sink). Using a spherical coordinate system, it can be shown that the velocity is directed toward the origin with a magnitude (U) that depends only on the radius (R). For a steady flow, the volume flow rate across any hemiphere upstream of the jet must equal the volume flow rate in the jet.
Q = 2p R2 U
The suggested procedure is to find a region where the flow is hemispherical. Set the colour scale to give a particular colour at a convenient velocity (say 10 cm/s). Measure the radius where that velocity occurs and use the equation to calculate volume flow rate. Simple?
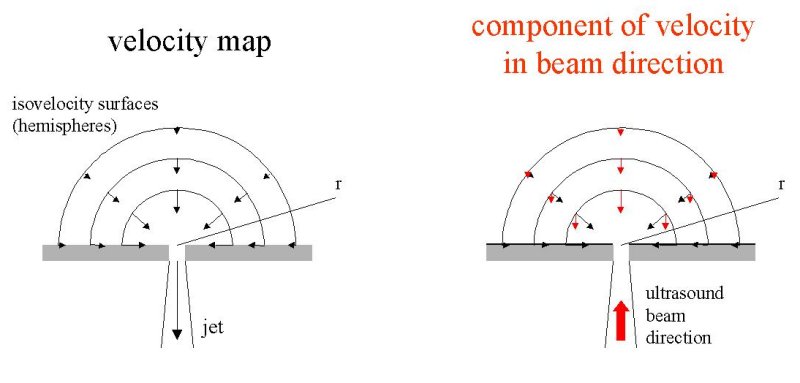
There is a fundamental error in this measurement. The Doppler probe measures not velocity but the component of velocity in the direction of the beam. Thus, if a sink flow was measured by Doppler on each isovelocity hemisphere, the component of velocity in the direction of the beam would vary with position on the hemisphere. Thus the Doppler velocity at the top of the hemisphere would be the isovelocity velocity but at all other points on the hemisphere the Doppler velocity would be reduced by the cosine of the angle of that point from the vertical. Near the plane, for example, the flow would be directed inward toward the origin (the location of the sink) and its component in the direction of the ultrasound beam would be very small.