BSc School C Level 2b Module 7
Physiological Monitoring
Notes for lectures on Cardiovascular Measurements
by K.H. Parker
Lecture 3: Physical Measurements in the Large Blood
Vessels
"...for I dreamt last night of
bloody turbulence."
Troilus and Cressida - William Shakespeare
We will concentrate primarily on the interpretation of measurements of
pressure and flow (or velocity) in the large arteries rather than the
measurements themselves. Since about 50% of the population of the UK will die
of arterial disease, a great deal of attention has been paid to the arteries.
By comparison, relatively little is known about flow in veins
Pressure and flow in the large arteries exhibit complex, pulsatile
waveforms
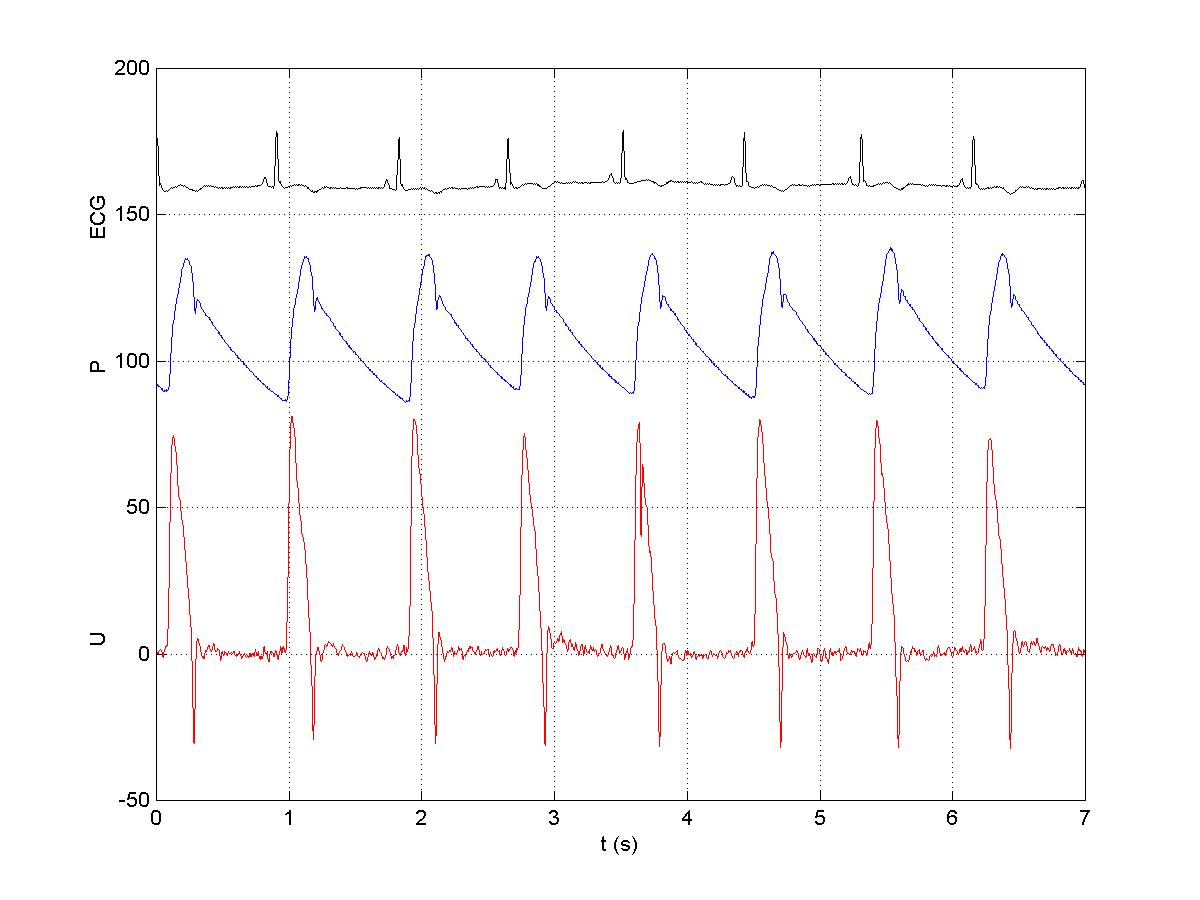
The figure shows the ECG (for reference), the pressure (P) in
mmHg and the velocity (U) in cm/s in the ascending aorta. These data were
measured invasively using a catheter.
One of the prominent features of arterial flow is that the
pressure and velocity produced by the contraction of the left ventricle (LV)
produce a wave which propagates throughout the arterial system, the pulse wave.
These waves were first analysed scientifically by Thomas Young in his Croonian
Lecture to the Royal Society in 1808.
Note that the flow is very pulsatile, increasing rapidly,
reaching a peak, decelerating until the reversal of flow through the aortic
valve closes the valves at the end of systole. There is no velocity during
most of diastole. This is not true of flow in the carotid artery (and the
uterine artery in pregnancy) where the flow is still pulsatile but there is
substantial forward flow during the whole of diastole. Why do you think this is?
The 'stroke' volume ejected by the LV (approximately 50 ml) is
slightly less than the volume of the ascending aorta. Therefore, the blood
reaching the microcirculation is several heart beats 'away' from the LV.
Note that the pattern of flow in the coronary arteries is
very different. Because the contraction of the myocardium occludes the vessels
within it, flow during systole is either zero or greatly reduced. When the
myocardium relaxes, blood can once again flow through the coronary
microcirculation and so flow in the coronary arteries is highest during
diastole. It has been argued that the need to perfuse the heart during diastole
is the reason that the mean blood pressure in the systemic circulation is high.
It has to drive flow through the coronary circulation during diastole.
Impedance Analysis
The standard way of analysing pressure and flow in the arteries
is a Fourier transform based method generally known as impedance analysis
in reference to the analogous analysis of electrical circuits.
Refer to:
Nichols and O'Rourke, MacDonald's Blood Flow in the
Arteries (4th ed.).
Milnor, Hemodynamics.
In this method, the pressure, P(t), and velocity, U(t) (or, alternatively,
the volume flow rate), are expressed as the linear superposition of sinusoidal
waveforms using the Fourier transform
P(w)
= F{P(t)}
U(w)
= F{U(t)}
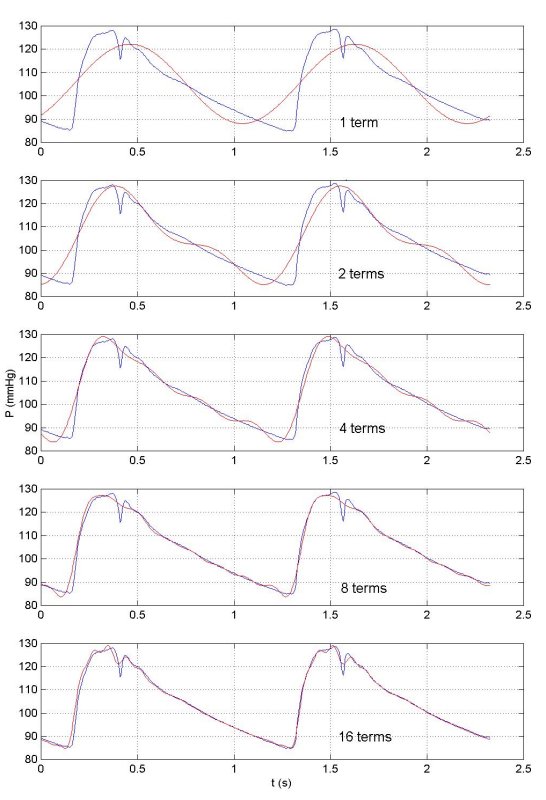
Surprisingly few harmonics are necessary to build up a
very good approximation to the experiementally measured waveforms. This is shown
here where the original waveform (in blue) is compared to the first harmonic
wave (in red), the sum of the first and second harmonics, the sum of the first
four harmonics, eight harmonics and finally sixteen harmonics. We see that
sixteen harmonics are sufficient to reproduce most of the detail of the measured
waveform.
Because the Fourier transform is complete, summing all of the
harmonics will give the initial waveform exactly, noise and all.
By analogy to Ohms law, relating voltage and current in
electrical circuits, it is assumed that the pressure and velocity for each
harmonic are related
P(w)
= U(w)
Z(w)
where Z(w)
is called the impedance. Because P(w)
and U(w)
are complex numbers (they have a real and imaginary part), Z(w)
is also complex. It is usually represented by the polar form, i.e. its magnitude
|Z| and phase f,
where
Z(w)
= |Z| eif
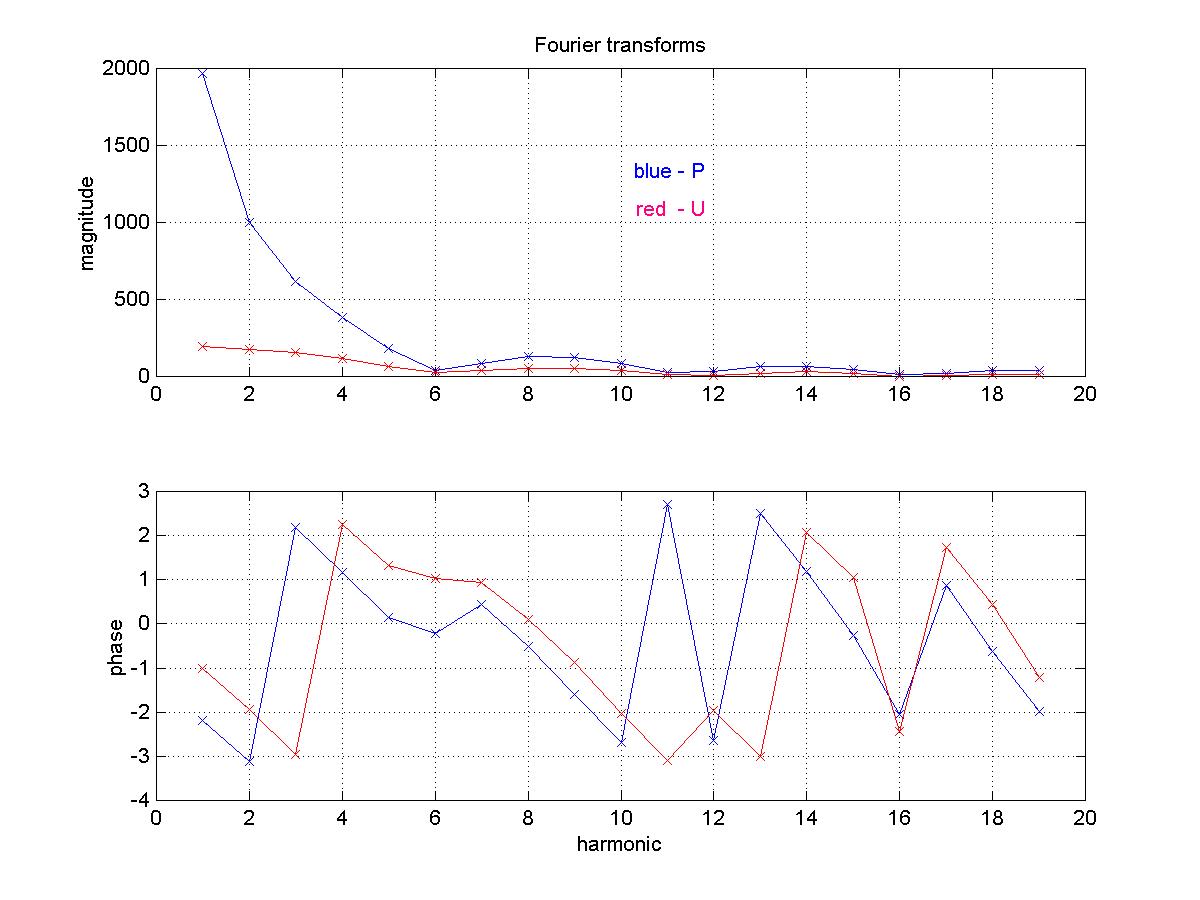
For the data shown previously, the second beat in the figure
showing P and U above,
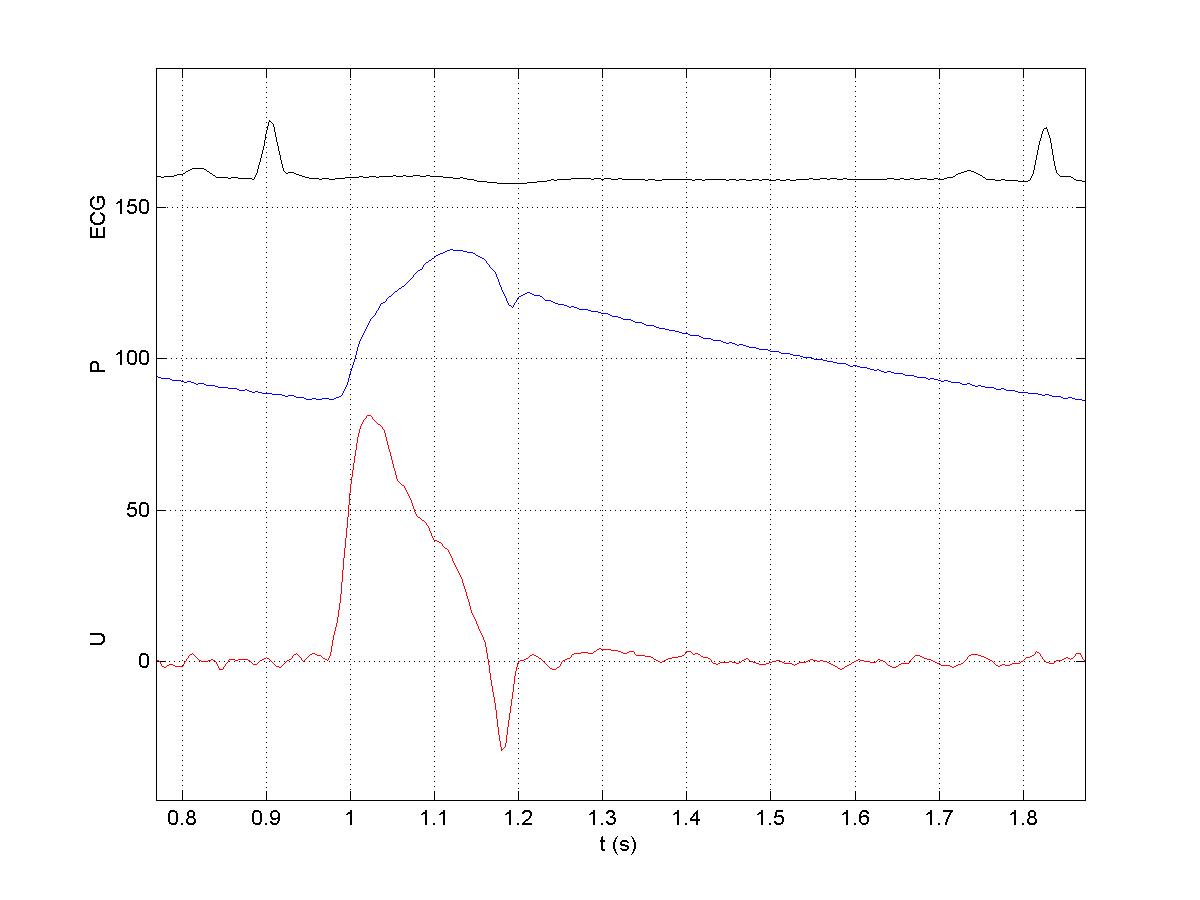
the P(w)
and U(w),
magnitude and phase, are
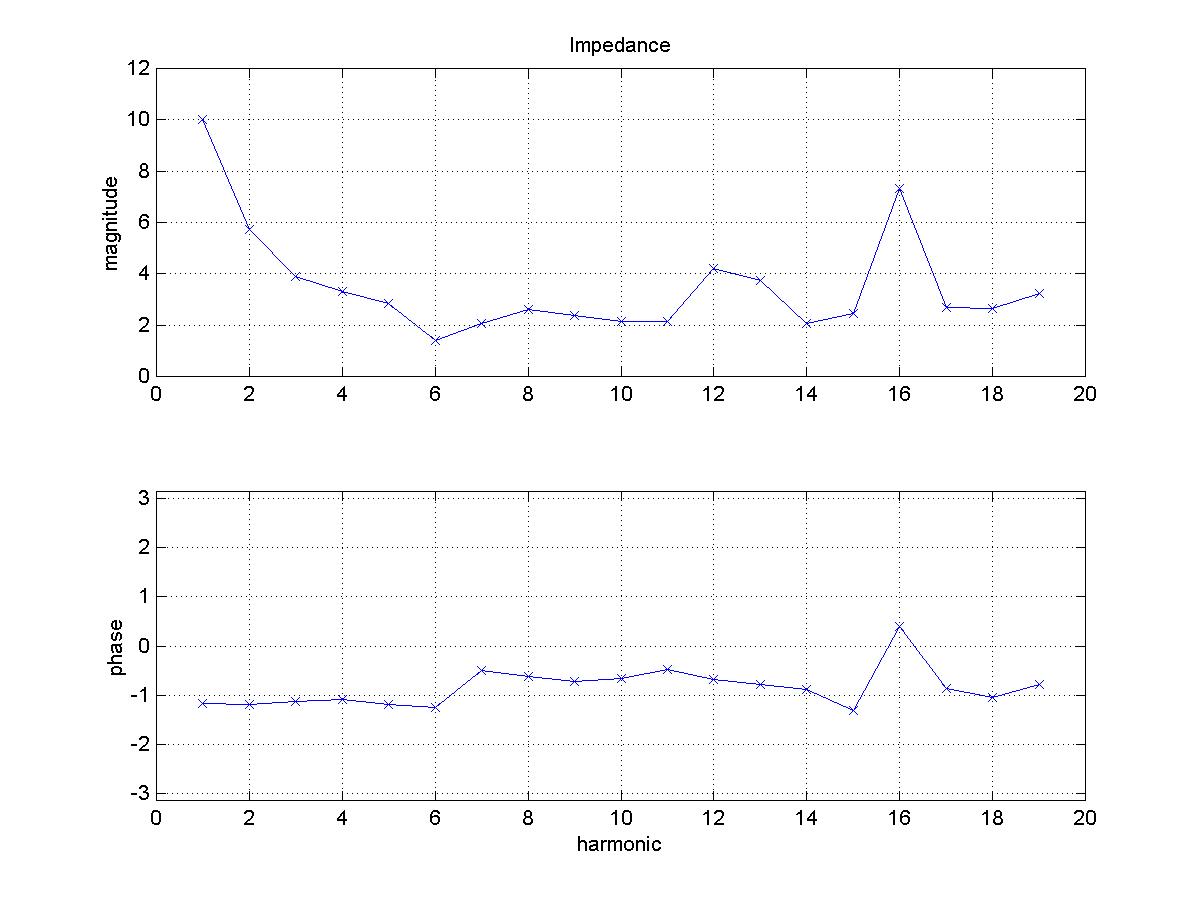
The impedance, magnitude and phase, calculated from these data
is