The pulmonary circulation conveys the entire output of the right ventricle via the pulmonary arteries to the alveolar capillaries and returns the blood, via the pulmonary veins, to the left atrium. The lung has a second, though far smaller, circulation, the bronchial circulation. This arises from the thoracic aorta, supplies systemic arterial blood to the lung, has some interconnections (anastomoses) with the pulmonary microcirculation and drains into the systemic venous system.
The pulmonary circulation differs from the systemic circulation in several important respects. For example, it is a low pressure, low resistance system; the time average excess pressure in the pulmonary arteries is only about 2 x 10³ N m-2 (15 mm Hg or 20 cm H2O), or approximately one sixth of that in the systemic arteries, while the total blood flow-rate through the lungs is the same as that through the systemic circulation. Further differences are that the pulmonary arteries have much thinner walls than the systemic arteries, and the pulmonary vascular bed is apparently not regionally specialized. In addition vasomotor control in the pulmonary vessels is believed to be relatively unimportant under normal conditions; unlike the systemic arteries and veins, the vessels do not undergo large active changes in their dimensions.
The main function of the lungs is the exchange of oxygen and carbon dioxide between the air and the blood. However, any gas for which there is a difference in partial pressure between pulmonary capillary blood and alveolar gas will diffuse across the alveolar capillary membrane. Important gases include the anaesthetics, for example nitrous oxide; the rate of uptake of respired nitrous oxide is actually used as a means of measuring the instantaneous pulmonary capillary blood flow-rate (§15.4 and Fig. 15.17). The uptake of carbon monoxide, in tracer quantities, is used for measuring both the diffusing capacity of the lung and the pulmonary capillary blood volume (§15.2.4).
In addition the pulmonary circulation performs certain mechanical functions, by virtue of the flexibility of its vessels. We have seen that the return of blood to the right side of the heart from the extra-thoracic and extra-abdominal systemic veins is transiently interrupted by straining, coughing etc. (§14.5.3), when the intra-thoracic and intra-abdominal pressures are raised. During such periods the flow of blood to the left atrium and ventricle, and hence to the systemic arteries, is temporarily maintained by blood draining from the pulmonary blood vessels; since there is a reduction of the rate of inflow of blood to the pulmonary circulation, the volume of blood they contain is reduced. The pulmonary blood vessels are effective, furthermore, in attenuating pressure and flow oscillations, generated by opposing contractions of the right and left sides of the heart, which could interfere with the flow of blood in the pulmonary circulation (§15.3 and Fig. 15.14).
Two other important functions of the pulmonary circulation may be mentioned here. First, it acts as a sieve to remove abnormal particulate material circulating in the blood. Thus an embolus resulting from the detachment of a thrombus which has formed in a systemic vein, or the right side of the heart, will lodge in the pulmonary vascular bed. That may not seem desirable, but provided it is relatively small no serious disturbance may ensue, and fibrinolytic mechanisms (§10.4) may lead to its dissolution. This is quite different from the state of affairs when a similar embolus lodges in the circulation of a small highly specialized organ such as the brain. Secondly, the pulmonary circulation appears to have an important role in influencing the chemical composition of the blood by either removing or adding substances to it, as it flows through the lungs; for example, during a single passage of the blood there is a substantial conversion of the vasoconstrictor substance angiotensin I to its active form angiotensin II,. almost complete inactivation of the vasodilator substance bradykinin and removal of 5-hydroxytryptamine (5HT), an amine important in platelet and central nervous function.
The mechanics of the pulmonary circulation are, as we shall see, affected to a major extent by the mechanics of the lung. It is for this reason that an entire chapter is devoted to the pulmonary circulation in which considerable attention is given to the influence of lung mechanics.
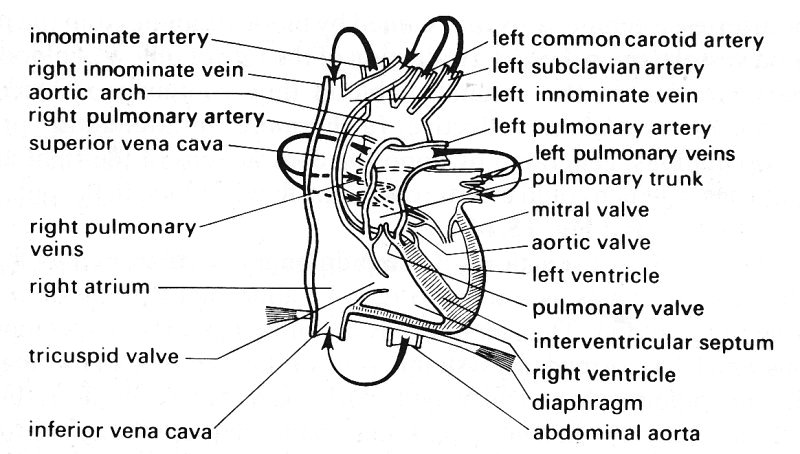
15.1.1 Pulmonary circulation. The pulmonary arterial system starts at the pulmonary valves. The main pulmonary artery (pulmonary trunk), like the aorta, has sinuses behind the valve cusps. In man the trunk is 5-6 cm in length and 2.5-3.0 cm in diameter, and it passes upwards and backwards, as shown in Fig. 15.1, to lie beneath the aortic arch, where it divides into the right and left main pulmonary arteries.
Fig. 15.1. Diagram of the heart and great vessels in man seen from the front. The arrows denote the direction of blood flow. (After Pauchet and Dupret (1937). Pocket atlas of anatomy (3rd edn). Oxford University Press.) A simpler illustration of the circulation through the heart is shown in Fig. 11.1.
(In the dog the anatomy is similar, but the vessel is shorter (3-4 cm) and narrower (1.4-1.7 cm diameter).) These pass towards the corresponding lungs, but before entering them divide into several branches, which supply the different lobes. The arteries, as they enter the lungs at their hila (points of attachment) and as they branch farther, are surrounded by sheaths of connective tissue. These are extensions of the pleura, the connective tissue membrane which envelops the lung and also surrounds the bronchi. The pulmonary arteries and bronchi do not penetrate these sheaths to enter the substance of the lung until the level of the terminal air spaces (see Fig. 15.3 and Table 15.1).
Table 15.1 Numbers and dimensions of vessels in human pulmonary arterial system* |
|||||
| Order | Number of branches | Diameter, d (cm) |
Length, l (cm) |
l/d | Number of end branches |
| 17 | 1.00 | 3.000 | 9.05 | 3.00 | 3.00 x 10⁸ |
| 16 | 3.00 | 1.483 | 3.20 | 2.16 | 1.00 x 10⁸ |
| 15 | 8.00 | 0.806 | 1.09 | 1.35 | 3.02 x 10⁷ |
| 14 | 2.00 x 10 | 0.582 | 2.07 | 3.56 | 1.38 x 10⁷ |
| 13 | 6.60 x 10 | 0.365 | 1.79 | 4.90 | 3.98 x 10⁶ |
| 12 | 2.03 x 10² | 0.209 | 1.05 | 5.02 | 1.16 x 10⁶ |
| 11 | 6.75 x 10² | 0.133 | 0.66 | 4.96 | 3.47 x 10⁵ |
| 10 | 2.29 x 10³ | 0.085 | 0.47 | 5.54 | 8.92 x 10⁴ |
| 9 | 5.86 x 10³ | 0.053 | 0.32 | 6.05 | 4.81 x 10⁴ |
| 8 | 1.76 x 10⁴ | 0.035 | 0.21 | 6.00 | 1.60 x 10⁴ |
| 7 | 5.26 x 10⁴ | 0.022 | 0.14 | 6.36 | 5.36 x 10³ |
| 6 | 1.57 x 10⁵ | 0.014 | 0.09 | 6.43 | 1.79 x 10³ |
| 5 | 4.71 x 10⁵ | 0.009 | 0.07 | 7.78 | 5.98 x 10² |
| 4 | 1.41 x 10⁶ | 0.005 | 0.04 | 8.00 | 2.00 x 10² |
| 3 | 4.23 x 10⁶ | 0.003 | 0.03 | 10.00 | 6.66 x 10 |
| 2 | 1.27 x 10⁷ | 0.002 | 0.02 | 10.00 | 2.37 x 10 |
| 1 | 3.00 x 10⁸ | 0.001 | 0.01 | 10.00 | 1.00 |
| * After Singhal etal. (1973). Circulation Res. 33, 190-7. | |||||
Fig. 15.2 shows a resin cast prepared from a human pulmonary arterial tree; vessels of diameter less than 0-08 cm have been pruned away to reveal the larger arteries. The branching is not dissimilar from that in the systemic arteries and veins, in that flow dividers are relatively sharp and branching occurs in different ways at different locations. For example, whereas the pulmonary trunk divides into two roughly equal main pulmonary arteries, seen in the centre of the cast, much of the remainder of the branching occurs by small arteries coming off larger ones. The pattern is seen also in Fig. 15.3, which shows a fragment from the periphery of the cast; the vessel in the spine of the fragment has a diameter of about 0-07 cm.
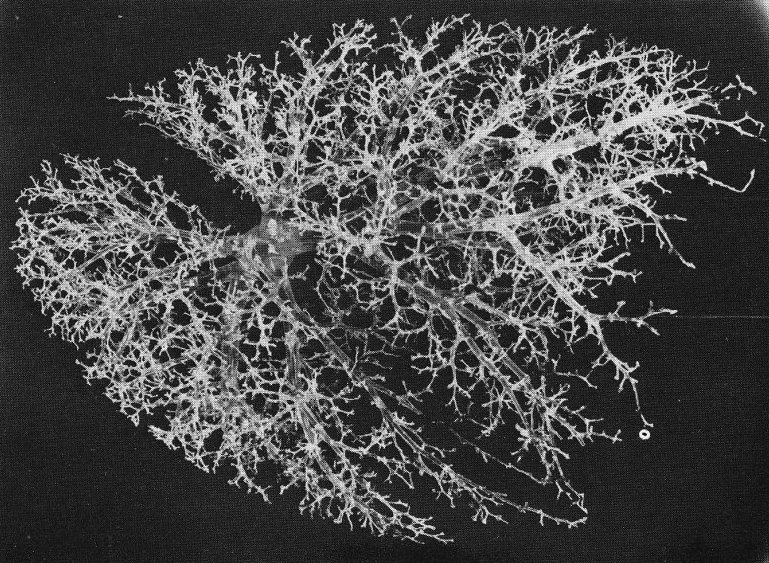
Fig. 15.2. The pulmonary circulation of both lungs with branches broken off at diameters of 0-08 cm, showing the general pattern of branching. (From Gumming, Henderson, Horsfield, and Singhal (1969). 'The functional morphology of the pulmonary circulation'. In The pulmonary circulation and interstitial space (ed. Fishman and Hecht). University of Chicago Press.)
It is not a simple task to describe such a branching system. One method is to place the branches in generations, counted downwards from the most central vessel, and another is to place them in orders, counted upwards from the most peripheral vessels. In the pulmonary circulation, where there is considerable asymmetry of branching, vessels of similar size may arise at different generations and the first system cannot give an accurate representation. The second system, discussed in detail in the reference given in Table 15.1, though more difficult to apply, does at least class vessels of similar size in the same order. On application of this system to measurements from the human cast shown in Figs 15.2 and 15.3, some average values have been computed to describe the tree (Tables 15.1 and 15.2). It is seen that the length to diameter ratio of the larger arteries lies between 1.35 and 3.0 and that the ratio is greater in the smaller arteries, reaching a value of 6-10. The total length of an average pathway, from the beginning of the pulmonary trunk to the capillaries, is about 20 cm.
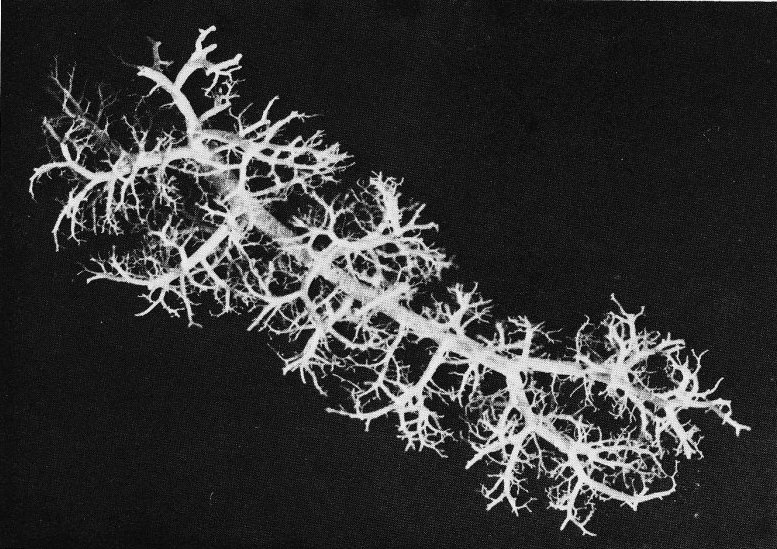
Fig. 15.3. A small branch of the pulmonary arterial tree showing the pattern of branching. (From dimming, Henderson, Horsfield, and Singhal (1969). 'The functional morphology of the pulmonary circulation'. In The pulmonary circulation and interstitial space (ed. Fishman and Hecht). University of Chicago Press.)
As seen in Table 15.2 the total cross-sectional area of the arterial bed actually decreases slightly initially, so that the mean blood velocity must increase for the first two branches away from the pulmonary trunk, but thereafter blood velocity falls. The mean Reynolds number must fall all along the tree, because the product of velocity and diameter falls. The area ratio (ratio of combined cross-sectional area of daughter vessels to that of parent vessel) at the bifurcation of the pulmonary trunk into the main pulmonary arteries is about 0.8, both in man and in the dog.
Table 15.2 Values computed from the data in Table 15.1* |
|||||
| Order | Cross-sectional area (cm2) |
Total cross- sectional area (cm2) |
Total volume (cm3) |
Cumulative volume (cm3) |
Velocity (cm s-1) |
| 17 | 7.07 | 7.07 | 63.97 | 63.97 | 11.3 |
| 16 | 1.73 | 5.18 | 16.58 | 80.55 | 15.4 |
| 15 | 5.10 x 10⁻¹ | 4.08 | 4.45 | 85.00 | 15.8 |
| 14 | 2.66 x 10⁻¹ | 5.32 | 11.01 | 96.01 | 13.8 |
| 13 | 1.05 x 10⁻¹ | 6.91 | 12.36 | 108.37 | 10.2 |
| 12 | 3.43 x 10⁻² | 6.96 | 7.31 | 115.68 | 9.0 |
| 11 | 1.39 x 10⁻² | 9.38 | 6.39 | 121.87 | 6.7 |
| 10 | 5.67 x 10⁻³ | 12.99 | 3.09 | 127.96 | 4.2 |
| 9 | 2.17 x 10⁻³ | 12.69 | 4.01 | 131.97 | 5.9 |
| 8 | 9.68 x 10⁻⁴ | 16.99 | 3.57 | 135.54 | 4.5 |
| 7 | 3.94 x 10⁻⁴ | 20.71 | 2.86 | 138.40 | 3.6 |
| 6 | 1.50 x 10⁻⁴ | 23.54 | 2.14 | 140.54 | 3.2 |
| 5 | 5.81 x 10⁻¹ | 27.38 | 1.78 | 142.32 | 2.7 |
| 4 | 2.29 x 10⁻¹ | 32.31 | 1.42 | 143.74 | 2.3 |
| 3 | 9.08 x 10⁻⁶ | 38.37 | 1.11 | 144.85 | 2.0 |
| 2 | 3.46 x 10⁻⁶ | 43.85 | 0.88 | 145.73 | 1.8 |
| 1 | 1.53 x 10⁻⁶ | 398.20 | 5.18 | 150.91 | 0.2 |
| * Values of cross-sectional area are for a single branch. Total cross-sectional area is the summed area of all the branches in each order. Total volume is the summed volume of all the branches in each order. Cumulative volume is the total volume added cumulatively from higher to lower orders. Velocity is mean velocity of blood flow if pulmonary blood flow rate is 80 ml s~1 (After Singhal et al. (1973). Circulation Res. 33, 190-7.) | |||||
In the pre-capillary vessels of the pulmonary circulation the branching pattern is different from that described above: a single pre-capillary vessel 15-25 mm in diameter gives rise to a number of capillaries which lie in the alveolar septa and course over the surface of the alveoli. It seems that one pre-capillary vessel supplies capillaries to several adjacent alveoli, though whether in series or in parallel is not known.
A conventional view of the pulmonary capillaries is that, like those in the systemic microcirculation, they are cylindrical tubes. However, measurements have shown that their lengths are comparable with, and in some cases smaller than, their diameters, and that they are commonly flattened rather than circular. It is more appropriate, therefore, to regard the blood in the alveolar septum as a sheet of fluid flowing between almost parallel alveolar membranes which are held apart by frequently occurring posts of connective tissue (Fig. 15.4). In the cat lung, which has been studied in detail, these posts typically occupy about 10 per cent of the area of the sheet.
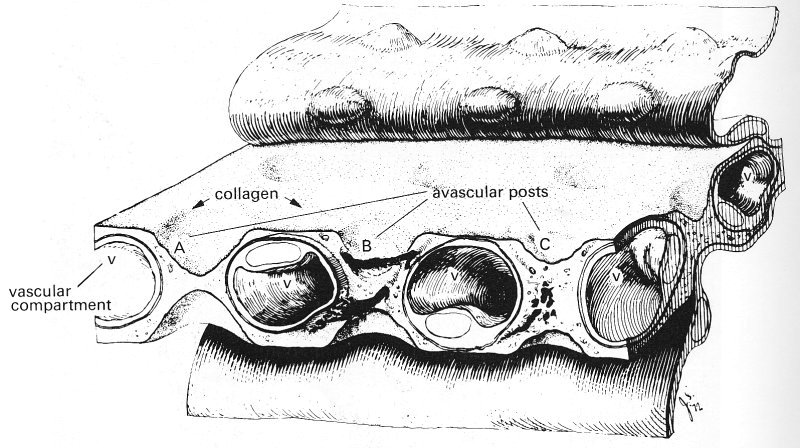
Fig. 15.4. A composite drawing of the pulmonary interalveolar wall of the dog showing the interalveolar microvascular sheet composed of a vascular compartment (the capillary bed) and the intercapillary posts. The alveolar epithelium has been pulled back to show the connective tissue matrix of the wall. Collagen converges on the post from the surrounding capillary wall. (From Rosenquist, Berrick, Sobin, and Fung (1973). "The structure of the pulmonary interalveolar microvascular sheet', Microvascular Research 5, 199-212.)
The pulmonary arteries have far thinner walls than do systemic arteries of comparable size. The ratio of wall thickness to diameter (h/d) takes a value of about 0.01 for the pulmonary trunk of a dog, comparable with the value for a systemic vein rather than a systemic artery; the value for the aorta for example, is about 0.07 (Table I). Histologically there are also striking differences. Pulmonary arteries, from the pulmonary trunk down to vessels of 0.1 cm diameter, are classified as elastic arteries, because in them the media consists predominantly of elastic tissue with little smooth muscle and collagen. The transition to muscular pulmonary arteries occurs gradually at this level (orders 10-11, Table 15.1) and vessels of diameter 0.1-0.01 cm are classified as muscular, because the media consists predominantly of muscle. In the systemic circulation this transition occurs in large arteries; for example, the coronary and femoral arteries, which are several millimetres in diameter and arise respectively from the aorta and common iliac arteries, are muscular.
The pulmonary vascular bed is also distinctive in that it possesses no counterpart to the small muscular arteries and arterioles of the systemic circulation. For example, a 60 mm diameter pulmonary artery has a wall thickness of only 8 mm (h/d = 0.13) and possesses only a thin media. In the corresponding systemic arteries, h/d takes a value of 0.25-0.4 and the media is thick. Moreover, a 30 mm diameter pulmonary 'arteriole' has no detectable smooth muscle, whereas the muscle in the media is obvious in a systemic arteriole. It is difficult to imagine that the pulmonary arterioles, so lacking in muscle, are capable of intense vasoconstriction, indeed it seems probable that such vasomotion as occurs in the pulmonary arterial system is mainly effected by 0.01-0.1 cm diameter vessels, which have a well-formed media.
The tissue barrier which separates blood and air in the alveoli is extremely thin, with a thickness generally of about 0.2 mm (Fig. 15.5). It consists of the cells which line the alveoli (alveolar epithelium) and the capillaries (vascular endothelium) separated by a narrow interstitial space. In the neighbourhood of cell nuclei the barrier may be as thick as 10 mm. The endothelium is continuous with that of the entire circulation. On the alveolar side of the barrier there is a lining layer on the surface of the alveolar epithelium, composed of lecithins possibly linked to protein and known as the pulmonary surfactant. This has considerable importance in lung mechanics and influences the transmural pressure of the pulmonary capillaries (§15.2.2).
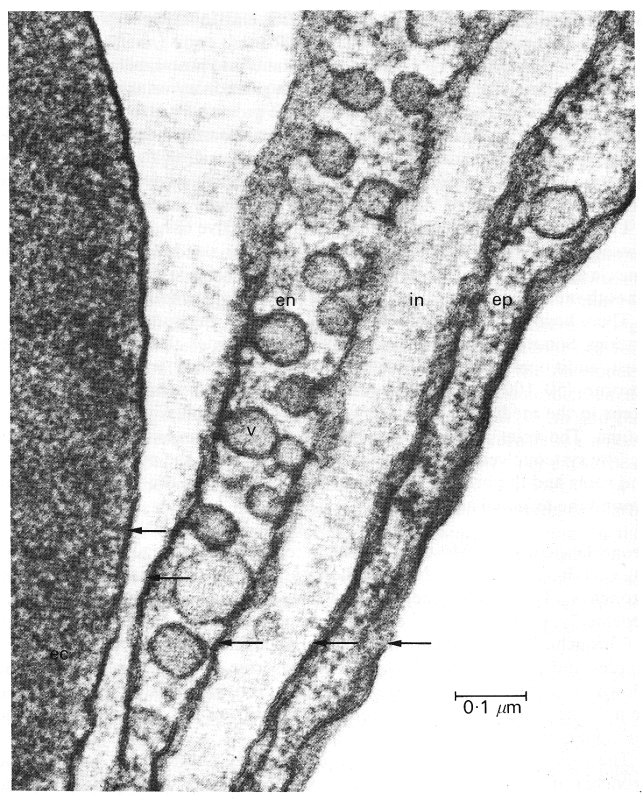
Fig 15.5. Electron micrograph of the alveolar-capillary barrier where it is very thin. On the left is an erythrocyte (ec). The arrows indicate the five cell membranes, that of the erythrocyte, and those of the capillary endothelial (en) and alveolar epithelial (ep) cells. Between the endothelial and epithelial cells is a narrow interstitial space. Pinocytic vesicles (v) are also shown. (From Weibel (1969). 'The ultrastructure of the alveolar-capillary membrane or barrier'. In The pulmonary circulation and interstitial space (ed. Fishman and Hecht). University of Chicago Press.)
The blood from the alveolar capillaries drains into post-capillary vessels and then into pulmonary venules and veins.* [* There appear to be some direct vascular communications between the pulmonary arteries and veins other than through the alveolar capillaries; these anastomoses are reported to be present in the neighbourhood of the terminal airspaces and to be up to 500 mm in diameter. Their physiological role has not been established.] The pulmonary veins run in the septa between pulmonary lobules, and, unlike the pulmonary arteries, are remote from the bronchi in much of their course. They leave the lung at the hilum and enter the left atrium, usually as two veins on each side (Fig. 15.1). The pulmonary veins have no valves, but like the systemic veins are thin-walled (Table I). Small pulmonary veins (diameter 0.01-0.1 cm) contain irregular elastic fibres and connective tissue in their walls and possess very little smooth muscle. Intermediate sized veins contain some muscle and elastin, and the largest pulmonary veins, while they have a media of smooth muscle, are mainly composed of a thick collagenous adventitia.
There have been only limited studies of the vasa vasorum of the pulmonary arteries. Some of these arise from the bronchial arteries, though in the rabbit at least, additional branches come from the coronary arteries. The larger vasa vasorum (50-100 mm diameter) run in the adventitia, whilst only smaller ones occur in the media. It is not known whether the capillaries extend into the intima. The veins are parallel to the arteries in their course and drain into nearby systemic veins. Lymphatic channels surround the pulmonary arteries and veins and the bronchi; they also drain lymph from the interstitial spaces around the terminal airways.
15.1.2 Bronchial circulation. Most commonly there are two bronchial arteries supplying each lung. They arise from the aorta and run into the lung with the main bronchus. Throughout their course they communicate with each other repeatedly, giving off branches to the pleura and finally dividing to supply all the bronchi. The bronchial circulation extends as far as the terminal bronchioles and provides blood to the vasa vasorum of the pulmonary arteries (down to a diameter of 0.1 cm) and to the peribronchial nerves. The bronchial veins drain into the superior vena cava, and, on a small scale, into the pulmonary veins.
The existence in normal lungs of pre-capillary anastomoses between the bronchial and pulmonary circulations has been established by injection studies. The vessels vary in diameter from 20 to 200 mm and are found principally in the region of the small bronchi. Their physiological role is not clear, though it has been suggested that they maintain a blood supply for small areas of lung which are temporarily not ventilated, or collapsed.
In this section we examine the static elastic properties of the pulmonary vessels and the forces acting upon them. The effective transmural pressure acting on pulmonary arteries in situ is difficult to determine for two reasons. One is that the internal pressure varies with position in the lung, as a result of hydrostatic effects. The other is that the effective pressure acting on the outside of the vessels depends upon the mechanical properties of the lung, the pressure in the thorax and the degree of lung inflation. It is necessary, therefore, to examine in detail the factors which determine both these pressures, as well as the elastic properties of the vessel walls.
15.2.1 Intravascular pressure. The pulmonary circulation is a low pressure system: the mean pressure above atmospheric (mean excess pressure) in the right ventricle and the large pulmonary arteries is normally about 2 x 10³ N m-2 (15 mm Hg or 20 cm H2O), although if can rise to about 4 x 10³ N m-2 in exercise (Fig. 15.11). The mean excess pressure in the pulmonary veins is about half this value (103 N m-2), indicating that the pressure drop across the pulmonary microcirculation is very much smaller than that across the systemic microcirculation. In man when upright the lung has a height of about 30 cm and the pulmonary arteries enter the lungs about half-way up. The hydrostatic gradient of pressure in the pulmonary arteries is about 0.1 x 10³ N m-2 per cm vertical distance, so that the pressure at the top of the lung is about 1.5 x 10³ N m-2 (15 cm H2O) lower than the mean excess pulmonary artery pressure. Similarly it is 1.5 x 10³ N m-2 (15 cm H2O) higher at the bottom of the lung. In the presence of blood flow there is a pressure drop of about 0.7 x 10³ N m-2 between the main pulmonary artery and the capillaries; thus the mean pressure is normally subatmospheric in the microcirculation of the upper part of the lungs.
15.2.3 Perivascular pressure. Pulmonary blood vessels can be separated into two groups: (i) the small vessels which lie in and around the alveolar septa (including the 'sheet' of capillaries), called alveolar vessels and (ii) the larger extra-alveolar vessels, which can again be subdivided into intra- and extra-parenchymal vessels, i.e., vessels lying within and outside the lung substance (actually, although we use these terms, the larger vessels lie within connective sheaths and are not strictly within the lung parenchyma, as noted in §15.1). The distinction between (i) and (ii) is made on functional, not anatomical, grounds, in that the two groups of vessels experience different values of external pressure. This can be demonstrated in an excised lung by filling the pulmonary arteries and veins with a fluid such as kerosene, which cannot enter the smaller vessels, because of interfacial tension. The level in the vasculature reached by the kerosene is determined by a balance between the hydrostatic pressure difference across the interface between the kerosene and the fluid it is displacing and the interfacial tension. Calculations indicate that a kerosene: water interface will be within 50 mm vessels when the hydrostatic pressure difference is 2 x 10³ N m-2. When the lung is inflated by increasing the air pressure in the alveoli (without changing the pressure at the surface of the lung, or that of the kerosene reservoirs - 'positive pressure inflation') the volume of the kerosene-filled vessels increases. However, when the whole vascular bed is filled with an aqueous solution of dextran, a similar manoeuvre causes the volume to rise by a smaller amount or to decrease. This can be accounted for only by a fall in the volume of the small vessels. In order to understand the mechanism we must examine what determines the pressure on the outside of the different sized blood vessels in the lung.
Consider first the extra-alveolar, intra-parenchymal vessels (Fig. 15.6 (a)).
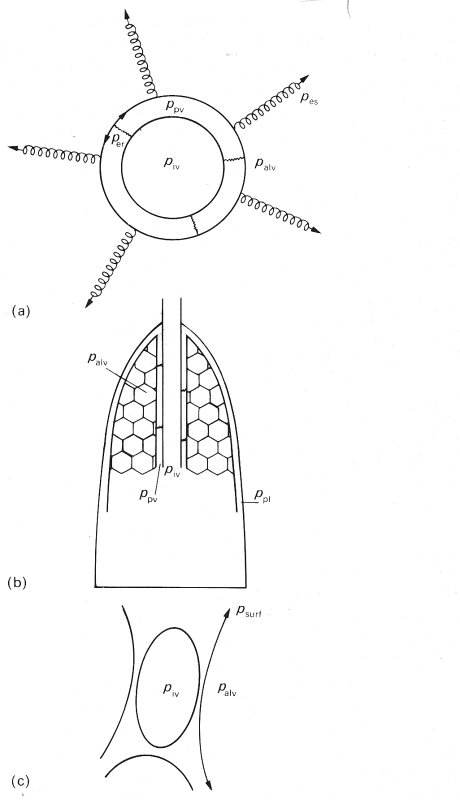
Fig. 15.6. Schematic diagrams illustrating the different factors determining intravascular pressure piv
(a) An extra-alveolar, intraparenchymal vessel surrounded by a perivascular space (pressure ppv) which is bounded by a membrane. This membrane is pulled outwards by the alveolar membranes (effective outward pressure pes) and pushed inwards both by alveolar pressure (palv) and by its own recoil pressure and that of the occasional connections between the membrane and the vessel wall (per).
(b) Indicating that, apart from the occasional connections, the perivascular space is continuous with the pleural space, where the pressure ppl is close to perivascular pressure ppv (see text).
(c) An alveolar vessel: perivascular pressure is approximately equal to alveolar pressure, apart from the small outwards pull of the alveolar membrane and the surfactant layer (psurf) on the vessel.
The pressure exerted on the outside of these vessels by the material in the perivascular space or sheath, which we shall call ppv, is not equal to alveolar gas pressure palv. for a number of reasons. The first is that if the neighbouring alveoli are at all inflated, the alveolar membranes pull outwards on the membrane surrounding the perivascular space, and this pulling is equivalent to a reduction of palv by an amount which we may call the 'elastic stretching pressure' pes. This effect, however, is reduced by the elastic recoil pressure of the perivascular membrane, less the effective outwards pressure exerted on the vessel wall by any elastic connections which may join the vessel wall to the perivascular membrane, which we call per. Thus
ppv = palv - pes + per (15.1)
If the lung were uniform, all alveoli would be equally inflated, and the same pes would be exerted on every surface of lung parenchyma, including the outer pleural surface (Fig. 15.6 (b)). Under static conditions at any volume palv is uniform, because all air spaces are in communication with each other, and it also follows that ppl, the pressure in the pleural space, the extremely thin space between the visceral pleura which covers the lung and the parietal pleura which lines the thorax, differs from ppv only if the elastic recoil pressure of the perivascular membrane is different from the net recoil pressure of the pleural membranes. In the case of extraparenchymal vessels, ppv is equal to ppl, because the perivascular space is the pleural cavity.
If the lung is inflated by positive pressure, paiv is increased and pes increases even farther, because of the non-linear elastic properties of the alveolar membranes, which become stiffer as they are stretched. The net effect of lung inflation is that ppv falls, so that if the pressure inside the vessel has remained constant, the transmural pressure rises, and the volume of the vessel also rises. This explains the observations in the kerosene experiments.
The above conclusions are not altered by the fact that, with the lungs inside the thorax, their mechanical properties are not uniform. For example, alveolar volume increases with height, because the pressure at the pleural surface (lung surface pressure) varies with height, in a manner determined primarily by the way in which the weight of the lungs is supported in the thorax. The vertical gradient of lung surface pressure is about 25 N m-2 (0.25 cm H2O) per cm; this is only a quarter as large as the hydrostatic gradient which would be expected if the fluid in all parts of the pleural cavity could communicate freely, so clearly it does not. We expect a similar vertical gradient in ppv, but even over a height of 30 cm (as in the lung in an upright human being), the total variation in perivascular pressure is no more than 0.75 x 10³ N m-2 (75 cm H2O), as compared with a 3 x 10³ N m-2 (30 cm H2O) variation in intravascular pressure.
Now consider the alveolar vessels (Fig. 15.6 (c)). The blood can be visualized as flowing between two opposing layers of capillary endothelium, held apart in places by endothelium-covered posts (Fig. 15.4). The capillary endothelium is covered in turn by a thin region of connective tissue, the alveolar epithelium, and an extremely thin layer of surfactant, which lines the alveoli. Perivascular pressure for these vessels is almost equal to alveolar pressure, the only differences being caused by the outward pull of the alveolar membrane and the surfactant (psurf) at the liquid-air interface. This conclusion has been verified by experiments in which the flow through the pulmonary vascular bed of isolated liquid-filled, liquid-submerged, lungs was observed to cease where arterial pressure was equal to alveolar pressure; under these conditions interfacial tension in the alveoli is essentially abolished, as are the vertical gradients of vascular and transmural pressure. In contrast, in similar, but air-inflated, lungs, suspended in air, the flow ceased only when the arterial and venous pressures were equal, even though venous pressure was slightly less than alveolar pressure. The magnitude of the contribution of the surfactant in these conditions has not, however, been established.
If the lung is inflated very slowly in situ by expansion of the thorax, palv remains essentially equal to atmospheric pressure, while ppl, and hence also ppv, decreases. In this case it is the fall in ppv which, in Equation (15.1), balances the rise in pes associated with the stretching of the alveolar membranes. The fall in ppv means that the transmural pressure of the extra-alveolar vessels is increased. Since, however, palv does not change, there is little or no change in the transmural pressure of alveolar vessels, which therefore do not collapse as they may do during positive pressure inflation. They do, however, experience a reduction in thickness, because the alveolar septum is stretched (§15.2.3).
Consider what happens if the intravascular pressure of a blood vessel is reduced, other pressures being held constant. The reduction will cause a fall in the transmural pressure; if it becomes negative, as may happen normally towards the apex of the lung (see §15.2), this may lead the vessel to collapse, if it is an alveolar vessel. In an extra-alveolar vessel, a reduction of cross-sectional area would occur and that in itself would cause some local alveolar membranes to be stretched. Thus pes would locally be raised above its value elsewhere in the lung, so that ppv would be reduced (Equation (15.1)), and the tendency to collapse resisted. This phenomenon, known as interdependence, means that the presence of lung parenchyma in a state of inflation effectively reduces the distensibility of blood vessels (or airways) embedded in it. The magnitude of the reduction has not as yet been investigated quantitatively for pulmonary arteries. This limits the value of any predictions one may make of, for example, the pulse wave-speed in pulmonary arteries at different degrees of lung inflation.
Elastic properties. The properties of excised pulmonary arteries and veins can best be described with reference to the discussion of systemic veins in Chapter 14, especially Fig. 14.1 (§14.2). Like veins, pulmonary arteries are circular at transmural pressures of 2.0-2.5 x 10³ N m-2 (20-25 cm H2O) but are markedly non-circular when the transmural pressure is as low as 0.5 x 10³ N m-2 (5 cm H2O). This is also true in the excised but whole rabbit lung; we can expect, therefore, that the vessels become non-circular in vivo. The elastic properties of a large excised dog pulmonary artery, over the range in which it remains approximately circular, are compared with those of systemic veins and systemic arteries, also from the dog, in Fig. 14.3, §14.2. At physiological transmural pressures its Young's modulus has a similar value to that of the systemic arteries, but it is more distensible, because it has a much thinner wall than a systemic artery of comparable size; on the other hand it is less distensible than a systemic vein, because, although its wall thickness is comparable, the Young's modulus is greater. However, at equal values of transmural pressure the order is reversed, with the systemic arteries being the most distensible.
No similar study has been made of large pulmonary veins. However, the elastic properties of medium and small pulmonary arteries and veins in the dog (diameters 0.08-0.36 cm) have been determined. The lungs were excised and perfused and vessel diameters were measured radiologically. The average pressure-diameter results are shown in Fig. 15.7.
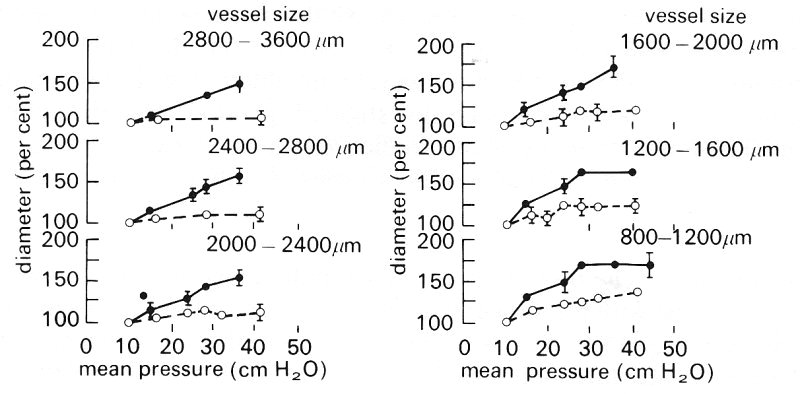
Fig. 15.7. Pressure-diameter relations for dog pulmonary arteries (filled circles) and veins (open circles) grouped according to size. Vessel diameters are expressed as a percentage of the value at an intravascular pressure of 8-10 cm H2O. Lung inflating pressure was 10 cm H2O. (From Maloney, Rooholamini, and Wexler (1970). 'Pressure-diameter relations of small blood vessels in isolated dog lung'. Microvasc. Res. 2, 1-2.)
Over the range of intravascular pressure 1.0-3.5 x 10³ N m-2 (10-35 cm H2O), when the vessels can be expected to be almost circular, arteries of diameter greater than 0.16 cm are seen to increase in diameter almost linearly with pressure, while smaller arteries increase in diameter linearly at first and then more slowly. In the case of the veins the diameter change for unit pressure change is considerably smaller and also, unlike the arteries, it is the medium and larger vessels (diameter greater than 0.12 cm) which tend to reach a diameter plateau, as pressure is increased.
Average values of distensibility D (Equation (14.1)) have been calculated from some of the results shown in Fig. 15.7. Over the intravascular pressure range 1.0-2.25 x 10³ N m-2 (10-22.5 cm H2O) the distensibility of the arteries ranges from 0.35 x 10⁻³ m2 N-1 for the largest vessels, to 0.88 x 10⁻³ m2 N-1 for the smallest. The distensibility of the veins over the same pressure range varies from 0.17 x 10⁻³ m2 N-1 for the largest vessels, to 0.35 x 10⁻³ m2 N-1 for the smallest. A distensibility of 0.35 x 10⁻³ m2 N-1 leads (from Equation (14.6)) to a predicted value for the pulmonary arterial pulse wave velocity of about l.7 m s-1, compared with the measured value (in dogs) of about 2.5 m s-1 (Table I).
Wall elastic properties have also been studied in the rabbit lung by measuring the apparent velocity of imposed small amplitude pressure waves, averaged over pathways of different length between the pulmonary trunk and other points in the pulmonary arterial tree. The values found were: interval 2 cm, velocity 0.55 m s-1; interval 3.2 cm, velocity 0.62 m s-1; interval 5.5 cm, velocity 0.80 m s-1. As in the systemic arterial tree, the apparent wave-speed clearly increases towards the periphery.
The above results apply to the pulmonary arteries and veins. We should also consider the elastic properties of the alveolar capillaries which comprise the sheet in the alveolar septum. It has been shown that the alveolar capillaries are distensible, by relating the number of red blood cells seen within them in rapidly frozen specimens of isolated perfused lung, to the vascular perfusing pressure immediately before freezing (Fig. 15.8).
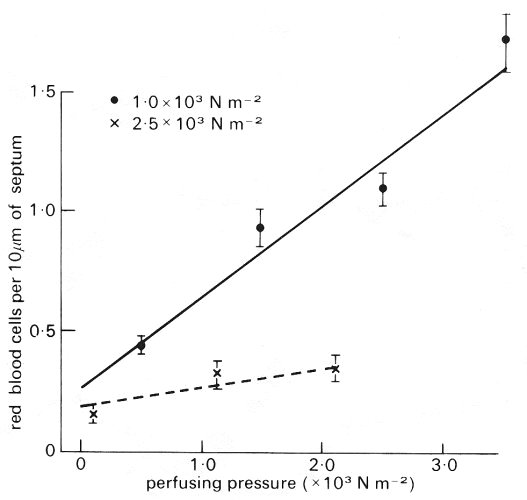
Fig. 15.8. Number of red blood cells per 10 mm of alveolar septum plotted against perfusion pressure. Since arterial pressure rises at the rate of about 1 cm water (102 N m-2) per cm distance, the perfusion pressure is equivalent to distance down the lung, zero representing the lung apex. Venous pressure was low. Measurements are shown at transpulmonary pressures of 1.0 x 10³ N m-2 and 2.5 x l03 N m-2 water. Note the rapid increase in the number of red cells down the lung when the transpulmonary pressure is 1.0 x 10³ N m-2 and the much slower increase when the lung is inflated to a larger volume (transpulmonary pressure 2.5 x 10⁻³ N m-2). (From West, Glazier, Hughes, and Maloney (1969). Pulmonary capillary flow, diffusion, ventilation and gas exchange. In Ciba Foundation Symposium on Circulatory and Respiratory Mass Transport pp 256-72. J. and A. Churchill, Edinburgh.)
At a lung inflating pressure (transpulmonary pressure) of l.0 x 103 N m-2 (10 cm H2O) the number of red cells increased almost linearly from about 0.4 per 10 mm to 1.5 per 10 mm length of septum, when the perfusing pressure was raised from about 0 to 3.5 x 10³ N m-2. The increase was much slower when the transpulmonary pressure was 2.5 x 10³ N m-2.
It has been observed that lung volume independently influences the dimensions of the alveolar capillaries and this is illustrated in Fig. 15.9.
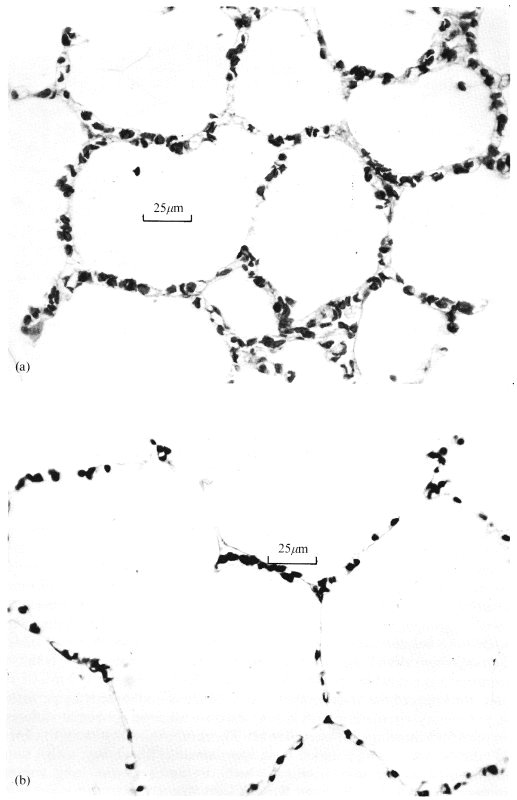
Fig. 15.9. Histological sections from perfused rapidly frozen dog lungs. The effect of transpulmonary pressure on the alveolar capillaries independent of capillary transmural pressure is illustrated - see text for description of study. (From Glazier, Hughes, Maloney, and West (1969). 'Measurements of capillary dimensions and blood volume in rapidly frozen lungs'. J. appl. Phvsiol. 26, 65-76.)
The histological sections are from rapidly frozen specimens of lung; in both cases the specimens are taken from sites 32-35 cm below the level where the venous pressure just balances the alveolar pressure so that the capillary transmural pressure is the same, but alveolar pressure is 1.0 x 10³ N m-2 (10 cm H2O) in (a) and 2.5 x 10³ N m-2 (25 cm H2O) in (b). In (b), consistent with the higher transpulmonary pressure, the alveoli are seen to be larger and there is a striking reduction in the number of red blood cells in the septum. These changes are probably brought about by the greater tautness of the alveolar walls at the higher lung volume. This is analogous to the situation in sheets of elastic material, where stretching in two directions (in the plane of the sheet) results in shrinking in the third (cf. §7.1).
The thickness of the alveolar sheet has been measured directly by perfusing the pulmonary circulation with a low viscosity silicone rubber at different pressures and allowing the material to set. The results show that sheet thickness increases with perfusing pressure in an approximately linear way, with a slope (proportional to the distensibility) which decreases as the lung volume increases (Fig. 15.10). We have already seen that alveolar size varies with position down the lung in situ (§15.2.2) and we may therefore expect corresponding differences in the sizes of the alveolar capillaries.
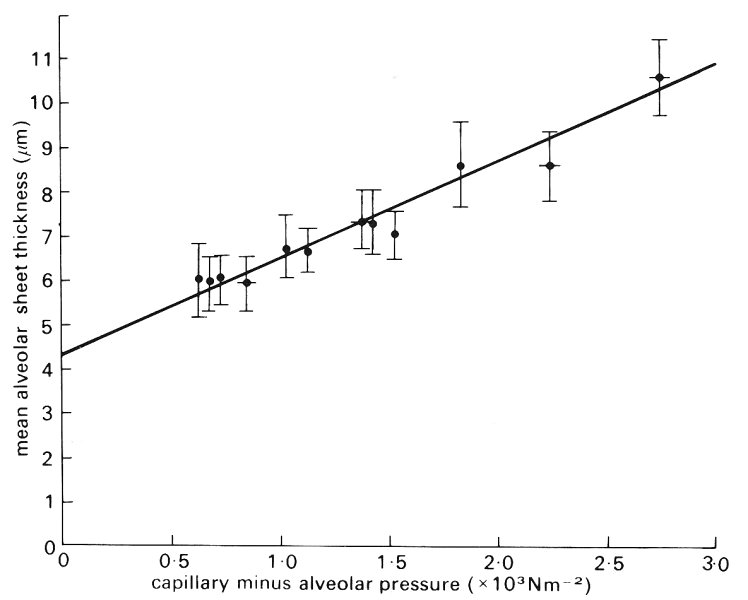
Fig. 15.10. Mean alveolar sheet thickness plotted against alveolar capillary transmural pressure in silicone-elastomer-perfused cat lungs. Over the transmural pressure range 0.6-2.7 x l03 N m-2 the graph is approximately linear. At zero transmural pressure (an extrapolated value) sheet thickness is 4.28 mm. (From Sobin, Fung, Trewer, and Rosenquist (1972). 'Elasticity of the pulmonary alveolar microvascular sheet in the cat'. Circulation Res. 30, 440-50.)
Pulmonary blood volume. One aspect of the static mechanical behaviour of the pulmonary circulation which is of considerable physiological and clinical importance is the volume of blood within it and its distribution between the different types of vessel.
The volume of blood within the pulmonary vascular bed and its constituent arteries, capillaries and veins has been estimated in various ways. The method most commonly employed to measure the total pulmonary blood volume is to inject an indicator into the pulmonary trunk and to sample blood from the left atrium to detect its arrival there; from this the mean transit time can be calculated. If the cardiac output can be measured at the same time, by some independent method, the volume of the pulmonary vascular bed can be deduced, because it is the product of the two quantities. In man the value is normally about 0.51 or 10 per cent of the circulating blood volume. The volume in the dog has been estimated at about 0.21.
The volume of blood in the pulmonary arteries in dogs has been measured in vivo using a modified indicator dilution procedure. The average pulmonary arterial volume measured in this way is approximately 50 cm3, that is about a quarter of the total pulmonary blood volume of 0.2 1. A variation of this technique has shown that pulmonary venous volume in the dog is approximately equal to pulmonary arterial volume. The volume of the pulmonary capillaries is therefore about one half of the total pulmonary blood volume.
The volume of a cast of the human pulmonary arterial tree has been found to be about 150 ml, of which about 80 per cent is within a few hundred vessels whose diameter is greater than 0.13 cm. The remainder is contained within the millions of smaller vessels. A note of caution should be sounded concerning these results, however, because the measurements on small vessels are particularly likely to be inaccurate. No similar data are known for the pulmonary veins.
The pulmonary capillary blood volume has been determined in vivo by a method involving measurement of the carbon monoxide diffusing capacity of the lung. The value depends on posture (see below), but in normal supine man it is about 100 ml. Assuming that these two results are correct, the pulmonary veins in man contain approximately half the total pulmonary blood volume. Note too that assuming a cardiac output of 5 1 min-1, the transit time of a red cell through the pulmonary capillaries is only about 1 s. In severe exercise the transit time has been calculated to be less than 0.5 s.
The volume of blood in the pulmonary circulation may vary according to physiological conditions. Measurements in supine man show that there is an increase of cardiac output, pulmonary arterial and venous pressure and total pulmonary blood volume when the legs are raised. If a supine passive subject is tilted head-up there is a fall in cardiac output, a slight decrease in pulmonary arterial and left atrial pressures, and a reduction of total pulmonary blood volume by 50-100 ml. However, as shown in Fig. 15.11, when a supine subject stands up, pulmonary artery pressure does not change appreciably; this suggests that the tone in the veins in dependent parts of the body has increased sufficiently to prevent the pooling of blood.
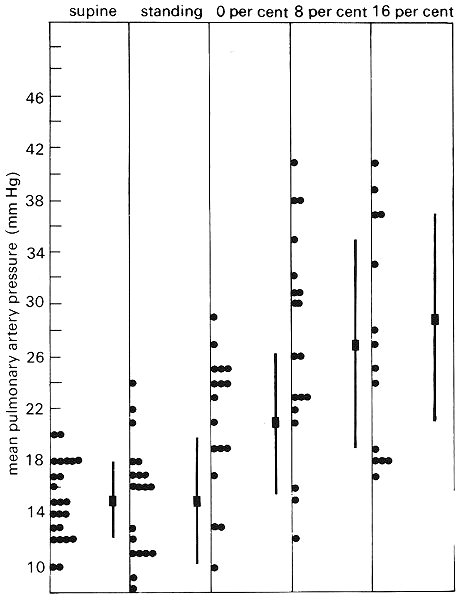
Fig. 15.11. Mean pulmonary artery pressure (10 mm Hg = 1.36 x 10³ N m-2) in 24 normal subjects. The columns show individual values and average values ± 1 SD, when the subjects are supine, standing at rest, and walking at 4.8 km h-1 on a treadmill which is horizontal; inclined at 8:100; and at 16:100. (From Damato, Galante, and Smith (1965). 'Haemodynamic response to treadmill exercise in normal subjects'. J. appl. Physiol. 21, 959-66.)
Fig. 15.11 also shows the effect of exercise on pulmonary artery pressure. The average pulmonary artery pressure was 15 mm Hg (2.0 x 10³ N m-2) when the subjects were standing at rest and approximately 30 mm Hg (4.0 x 10³ N m-2) when they were walking at 4.8 km h-1 on a treadmill with an incline of 16:100. They then had an average O2 consumption of 2.35 l min-1 as compared with the resting value of 0.35 l min-1, and a cardiac output of 17.5 1 min-1, as compared with the resting value of 5.1 1 min-1. Neither pulmonary venous pressure nor pulmonary blood volume was measured in the study. Other studies have shown, however, that exercise causes scarcely any change in left atrial pressure, though pulmonary blood volume is increased. For example, in normal adult subjects exercising and increasing their 02 consumption from 0.14 1 min-1 m-2 to 0.49 l min-1 m-2 (less severe exercise than that above) pulmonary artery pressure increased from an average of 13.9 mm Hg to 17.3 mm Hg (1.9-2.4 x 10³ N m-2) and pulmonary blood volume from an average of 0.28 1 m-2 to 0.35 1 m-2 body surface area.
Studies in dog lungs have confirmed that it is elevation of the pulmonary artery pressure, when the flow-rate is increased, which is primarily responsible for the increase of pulmonary blood volume. Thus, when lungs were perfused in situ by a pump, in such a way that the pulmonary artery and left atrial pressures could be controlled independently, total pulmonary blood volume did not change when the flow was decreased by increasing the left atrial pressure, while holding pulmonary artery pressure constant. However, as shown in Fig. 15.12, if left atrial pressure was held constant and the pulmonary artery pressure was raised by increasing the flow-rate, the total pulmonary blood volume increased. The rate of increase of volume with pulmonary artery pressure was 12 ml per cm H2O when the left atrial pressure was 5 cm H2O, and alveolar pressure exceeded venous pressure throughout the lung (zone II, see §15.4.2). It was 7 ml per cm H2O when the left atrial pressure was 33 cm H2O and venous pressure exceeded alveolar pressure throughout the lung (zone III, see §15.4.2). It has been suggested to explain this difference that there is a greater recruitment of previously closed channels with increase of pressure in the former case. The subject of recruitment is discussed further below.
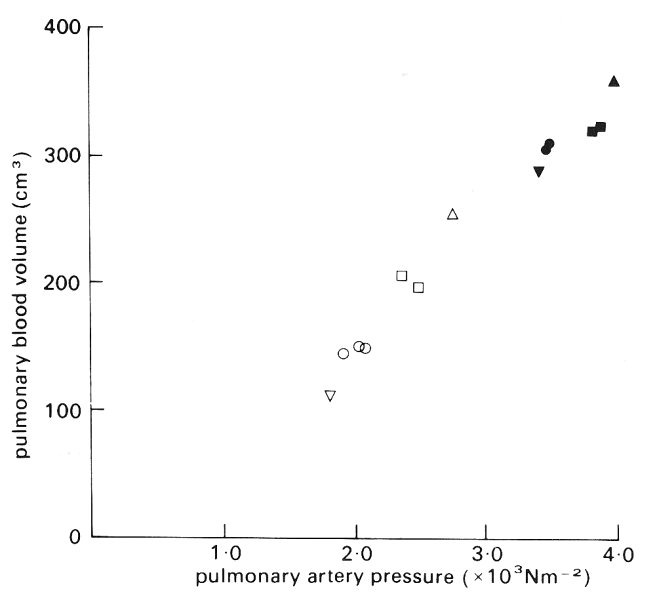
Fig. 15.12. Total pulmonary blood volume in perfused dog lungs, when pulmonary artery pressure was increased^ by increasing the blood flow-rate. Left atrial pressure was held constant at 0.5 x 10³ N m-2 (open symbols) and 3.3 x 10³ N m-2 (filled symbols). (From Maseri, Caldini, Harward, Joshi, Permutt, and Zierler (1972). 'Determinants of pulmonary vascular volume'. Circulation Res. 31, 218-28.)
It is clearly necessary to bear in mind the possibility that active changes in the tone of the smooth muscle of the pulmonary vessels could modify their mechanical response in studies of this type. There is no evidence that exercise is associated with an active change of the distensibility of the pulmonary arteries. However, it has been observed, in dog lungs perfused with a pulsatile flow from a pump, that stimulation of the sympathetic nerves to the lungs causes a reduction of pulmonary arterial distensibility, without altering pulmonary vascular resistance.
Pulmonary capillary blood volume also changes with physiological conditions. For example, manoeuvres which shift blood into the intrathoracic vessels, such as lying down or inflating a pressure suit on the legs and abdomen, increase the capillary blood volume, on average, from 70 ml to 100 ml. It should be appreciated, however, that the pulmonary capillaries have a limited capacity for distension. For example, further tilting the subjects, mentioned above, to a 60° head down position, though it increases the transmural pressure of their pulmonary vessels, caused no additional enlargement of their pulmonary capillary blood volume. Exercise also increased pulmonary capillary blood volume, which may more than double during maximal exercise. As in the experiments recorded in Fig. 15.12, this is associated with an increase in pulmonary artery pressure, not pulmonary venous pressure.
The lung volume also has an effect on the pulmonary capillary blood volume; in normal subjects it was slightly smaller, on average, when measured with the lungs fully expanded than when measured at resting lung volume. This is presumably related to the above observation in an isolated lung, that an increase of transpulmonary pressure reduces the density of the red cells in the alveolar septum.
There are two ways in which pulmonary capillary blood volume can be increased by an increase of pulmonary artery pressure. One is by distension of already open capillaries and the other is by recruitment of capillaries which were previously collapsed. It is known that at the apex of the lung in an upright subject at rest the capillaries are normally collapsed, with little flow through them, but that during exercise, when the pulmonary artery pressure is raised, flow occurs. Evidence from histological measurements of rapidly frozen dog lungs suggests that recruitment plays a very important role in this region when alveolar pressure is intermediate between pulmonary artery and pulmonary venous pressure (§15.4.2).
As shown in Fig. 15.13, the number of open capillaries per unit length of alveolar septum increases rapidly with pulmonary arterial pressure from about 25 mm-1 at 1 cm H2O pressure to 55 mm-1 at 12 cm H2O and thereafter there is little change. Though not shown here, results from the same study indicate that the length of alveolar septum occupied by each capillary increases steeply as perfusion pressure is increased above 12 cm H2O, indicating that there is then capillary distension, but little change in the number of open capillaries. These conditions reflect the situation near the apex of the upright human lung, where there is a reserve of unopened capillaries that can be called on when pulmonary artery pressure rises, as in exercise.
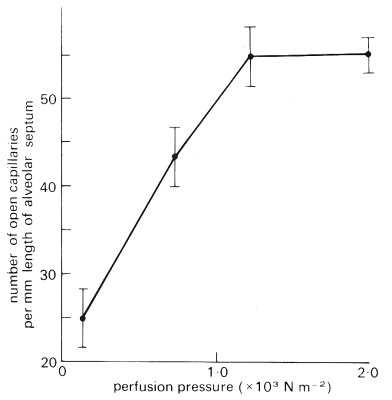
Fig. 15.13. Number of open capillaries per unit length of alveolar septum plotted against pulmonary arterial pressure: rapidly frozen dog lungs. (From Warrell, Evans, Clarke, Kingaby, and West (1972). 'Pattern of filling in the pulmonary capillary bed'. J. appl. Physiol.32, 346-56.)
In order to determine the relative contributions of recruitment and distension to an increase in pulmonary capillary volume, it is necessary to know the mechanism by which vessels are re-opened after being closed, the pressure required to open them, and their distensibility when open at different values of transmural pressure. It has been suggested that closure occurs in the pulmonary arterioles and that as pulmonary arterial pressure rises these vessels open. In fact the available evidence suggests that it is closure of the capillaries, not the arterioles, which is significant. Because of varying pathlengths and resistances upstream of sites of closed capillaries the arterial pressure may need to be very high before all vessels open, even though the pressure required to open individual capillary segments is very small. This subject has been explored by computer simulation.
In this section we describe the waveforms of pressure and flow-rate in large pulmonary arteries and veins, and discuss the propagation, attenuation and reflection of pressure waves in these vessels, with reference to their elastic properties which we have already described. We also outline the little that is known about flow patterns and velocity profiles in them.
Wave-forms. Typical wave-forms of blood pressure and flow-rate, recorded in the main pulmonary artery of a dog, are shown in Fig. 15.14. Also shown are the blood flow-rate wave-form in a large pulmonary vein and the blood pressure wave-form in the left atrium. The pulmonary arterial pressure has a time-average value of about 2.0 x 10³ N m-2 (15 mm Hg) and an amplitude of about l.0 x 103 N m-2, representing a 50 per cent variation about the mean, a considerably higher percentage than in a systemic artery (§12.2.2). The shape of the pressure wave-form does not differ greatly from that in the aorta. However, in slightly smaller arteries there is a difference, because the wave-form in systemic arteries changes markedly with distance, while there is no obvious change along the large pulmonary arteries. This might be because the pulmonary arteries are so short that the pressure pulse occurs almost simultaneously in all of them; however, this assumption would lead to significant errors in predicting the pulmonary arterial input impedance as a function of frequency (see Chapter 12 and §15.3.2).
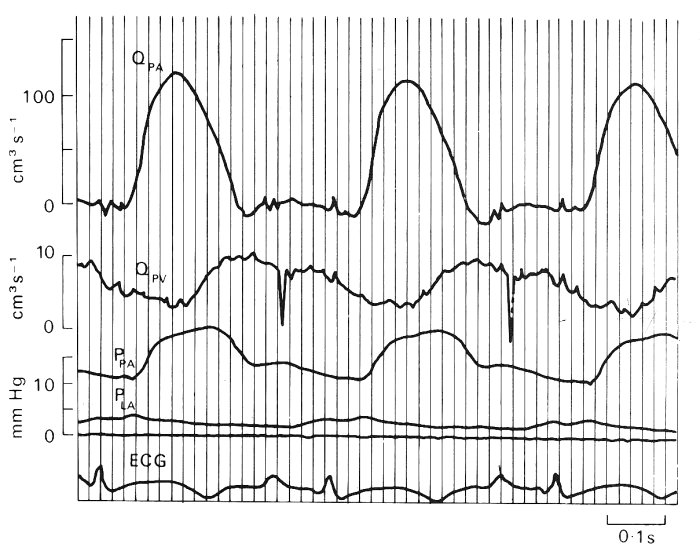
Fig. 15.14. Experimental records of pulmonary pressures and flows in a conscious dog at rest. Symbols: Q, blood flow-rate; P, pressure; PA, pulmonary artery; PV, pulmonary vein, within 2 cm of the left atrium; LA, left atrium; ECG, electrocardiogram, lead I. Sharp downward spikes in the pulmonary venous flow tracing and smaller spikes in the pulmonary arterial flow during diastole are electrocardiographic signals. Timing lines appear at intervals of 0-2 s. ((From Milnor (1972). 'Pulmonary haemodynamics'. In Cardiovascular fluid dynamics, (ed. Bergel), vol. 2, pp. 299-340. Academic Press, New York.)
There is a disagreement as to the origin of the pressure and flow-rate wave-forms in the pulmonary veins (Fig. 15.14). The question is whether they derive mainly from events in the right ventricle, having been propagated through the pulmonary microcirculation, or whether they are caused by retrograde transmission from the left atrium and ventricle. Evidence obtained when a lung is perfused experimentally, with a steady flow, and its normal venous connections to the left atrium are maintained, supports the idea that the venous pressure waves normally originate in the left heart; normal left atrial-type pressure wave-forms are seen in the pulmonary veins. However, if the veins are disconnected from the left atrium, the flow that emerges from them, in a lung which is perfused via its artery with a pulsatile flow, is pulsatile. Furthermore, pressure oscillations which resemble those in the pulmonary artery, but are delayed in time, are seen in a pulmonary vein, in vivo, if it is obstructed and the pressure is measured upstream of the obstruction. The time-average pressure has of course risen then to the pulmonary arterial level and the distensibility of the vein is consequently greatly reduced. These findings imply that the flow emerging from the pulmonary microcirculation into the veins, though it is normally pulsatile, generates little pressure oscillation in the veins, because they have a high distensibility at the physiological low values of transmural pressure. Microscopic observations on the pleural surface of the lung have revealed that blood flow in the superficial vessels of the microcirculation, including the precapillary vessels and alveolar capillaries, is pulsatile. Studies of the uptake of the highly soluble gas nitrous oxide by the lung confirms this finding. Fig. 15.15 is a schematic diagram of the variation of mean and pulsatile pressure and flow-rate through the pulmonary circulation; we give a description later (Fig. 15.17) of the pulsatile blood flow in the pulmonary capillaries.
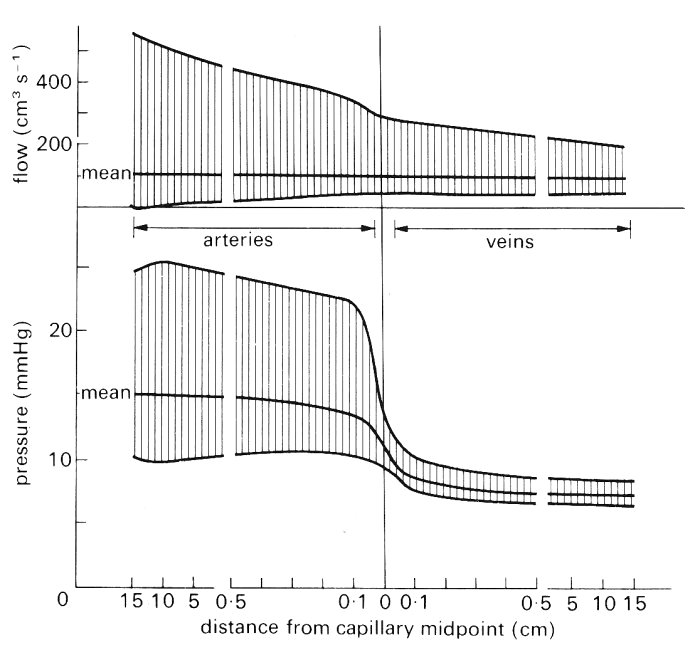
Fig. 15.15. Diagram of mean and pulsatile pressure (10 rnm Hg = 1.36 x 10³ N m-2) and flow along an average path through the human pulmonary vascular bed. Note changes of scale at 0.5 cm. (From Milnor (1972). 'Pulmonary haemodynamics'. In Cardiovascular fluid dynamics (ed. Bergel), vol. 2, pp. 299-340. Academic Press, New York.)
The mean blood velocity in the pulmonary trunk is approximately the same as in the aorta, because the two vessels have similar diameters and the entire cardiac output passes through them both. The peak velocity, however, is about half as high in the pulmonary trunk as in the aorta (about 0.7 m s-1 rather than l.2 m s-1).
Wave propagation. The speed of propagation of the pulse wave in pulmonary arteries has been measured in a number of species, including man, but the total amount of data in any one species is rather sparse. A typical value in man is about 1.75 m s-1, while the corresponding value in a dog (Table I) is about 2.5 m s-1. As already remarked (§15.2.3), the dog result corresponds fairly well with the values predicted from static distensibility measurements. Pulse wave velocities of 4-8 m s-1 have been measured in patients with pulmonary hypertension in whom there is pathological thickening and stiffening of the vessel walls.
Attenuation undoubtedly occurs as the wave is propagated through the pulmonary circulation, especially in the microcirculation, as shown in Fig. 15.15. However, no quantitative information is available on the rate of attenuation in particular vessels. This is because the experiment of generating short trains of high frequency waves, as was done in systemic arteries and veins (§12.5 and §14.3.2), has not been performed in pulmonary vessels. Lower frequency waves have been used, but measurement of the attenuation factor of such waves, over several arterial generations, does not distinguish between the effects of wave reflection and those of wall or blood viscosity.
Although visual inspection of pressure and flow-rate wave-forms reveals no significant change of shape as the wave propagates through the pulmonary arteries, Fourier analysis of the wave-forms (§8.6) does show a change in their harmonic content. As in systemic arteries this indicates either the presence of reflected waves or significant non-linear effects. Non-linear effects are expected to be small, because although the wave-speed is lower in the pulmonary trunk than in the aorta, the ratio of the peak velocity to the wave-speed is no larger than in the aorta. On the other hand, reflections are anticipated at any junction which is not well matched (i.e. which does not have an area ratio of about 1 if h/d remains constant; see §12.4.3). As in the systemic arteries, a useful and measurable indicator of the presence and site of reflections is the input impedance of the pulmonary circulation, defined for each frequency component as the ratio of the (complex) pressure and flow-rate measured at the same site in the pulmonary trunk (see §12.10 for a fuller definition of input impedance and its modulus and phase).
In Fig. 15.16 are shown calculated values of pulmonary arterial input impedance, derived from measurements in anaesthetized, open-chested dogs; the modulus is depicted above and the phase below. We see that the modulus falls from a high value at low frequency to a minimum at 3-4 Hz, when the phase becomes zero. At this frequency the pulmonary trunk is the site of a node (i.e. a minimum of pressure amplitude and a maximum of flow-rate amplitude), a result suggesting that there is partial, closed-end type reflection, at a distance of one quarter of a wavelength from the pulmonary trunk. If the wave-speed is 2.5 m s-1, with a frequency of 4 Hz, a quarter wavelength is about 16 cm, which is approximately the average path length to the microcirculation in a large dog. That there should be such a reflection site in the microcirculation is reasonable. The presence of the second maximum of the impedance modulus at about twice the frequency of the minimum supports the idea of reflection sites in the microcirculation, since the pulmonary trunk would be the site of an antinode for waves of twice the frequency (half the wavelength) of those for which it is the site of a node.
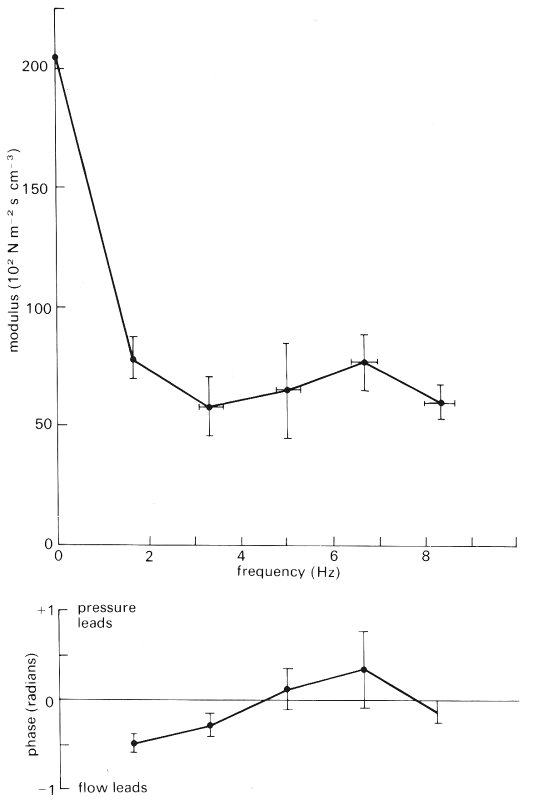
Fig. 15.16. Pulmonary arterial input impedance in anaesthetized, open-chest dogs. The points represent mean values in 29 animals; the bars represent ± 1 standard error of the mean. The modulus falls to a minimum at 3-4 Hz and at about the same frequency the phase crosses the zero line. At about 6 Hz there is a second maximum of the modulus. (From Milnor, Bergel, and Bargainer (1966). 'Hydraulic power associated with pulmonary blood flow and its relation to heart rate'. Circulation Res. 19, 467-80.)
The difference between the pattern shown in Fig. 15.16 and that found in the aorta (Fig. 12.29, §12.4.6) is probably explained by the relative symmetry of the pulmonary arterial tree, compared with that of the systemic arterial tree, which has shorter path lengths to the upper half of the body than to the lower (Fig. 12.31, §12.4.6).
The input impedance of the rabbit pulmonary circulation has been calculated on the assumption that all the pulmonary arteries expand and relax together (as in the Windkessel model, §12.3.1). That assumption might seem reasonable, because the length of a pulmonary arterial pathway to the microcirculation is much shorter than the wavelength (about one quarter of the wavelength at the heart rate). However, the results predicted a modulus which was below the measured value at all frequencies, with a minimum value close to zero at the resonant frequency of about 4 Hz. This is presumably a consequence of ignoring the multiple reflections which take place between the pulmonary trunk and the microcirculation.
The value of the modulus of the input impedance at zero frequency is a measure of the resistance offered to steady flow as it passes through the pulmonary circulation. This is a quantity which appears to depend very strongly on the degree of inflation of the lung, and the mechanism by which it is determined is quite complicated. We therefore postpone discussion of it to the next section, where an analysis of the resistance offered by the alveolar sheet is also briefly given.
Flow patterns. Rather little is known of the details of blood flow in the pulmonary arteries. Recent studies suggest that the velocity profile in the pulmonary trunk is relatively flat, as might be expected so close to the inlet from the right ventricle. Indeed, we can expect a fairly flat inlet profile in all the large pulmonary arteries (and veins), because the Reynolds number is large, the value of a is large, and the vessels are short so that new thin boundary layers begin on each flow divider, and never fill the tubes. The curvature of vessel walls near bifurcations seems to be small enough to prevent flow separation.
We can also expect variations of wall shear stress near bifurcations, as in systemic arteries. However, smaller blood velocity probes than are currently available are needed to study the details of the flow in the branches of the pulmonary vessels. The mean Reynolds number in the pulmonary trunk in a dog is about 600, and the peak about 3000; the value of a (for a heart rate of 2 Hz) is about 15. This puts the flow in the pulmonary trunk right on the borderline between laminar and turbulent, using the criteria which apply to the aorta (see Fig. 12.50). No evidence has so far been obtained to indicate the presence of turbulence in the normal pulmonary trunk.
Flow in the alveolar sheet. Blood flow in alveolar capillaries differs from that in systemic capillaries in two important respects. The first is that the capillaries are arranged as a sheet with flexible walls, which are held apart by the 'posts' (Fig. 15.4), and the second is that the flow is markedly pulsatile (Fig. 15.17). However, there are two fundamental respects in which the flows in the two types of capillary are the same. These are that (a) the Reynolds number is small (if a typical blood velocity in the sheet is 0.005 m s-1 and a representative sheet thickness at zero transmural pressure (h0) is 4 mm the Re is about 0.005), and (b) the value of a is small, even for the highest significant harmonics of the pulse wave (a = 0.0002 for a frequency of 10 Hz). This means that (a) fluid inertia is negligible, and the flow everywhere represents a balance between the pressure gradient and the viscous forces; and (b) the flow is quasi-steady so that the flow-rate wave-form is in phase with the pressure gradient wave-form at all parts of the sheet, at all times. For a Newtonian fluid in a rigid tube or sheet, these conditions would mean that the flow-rate through the system was always directly proportional to the pressure drop across it. In an elastic system that does not follow because the local pressure determines the sheet thickness, which determines the resistance to flow, so that the resistance is not independent of the driving pressure gradient. The presence of suspended elements in the blood also affects the resistance, as in the systemic microcirculation.
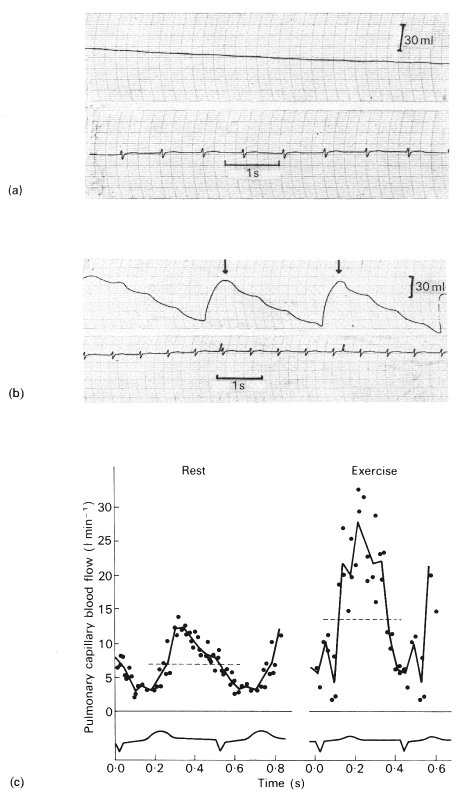
Fig. 15.17. Records demonstrating that pulmonary capillary blood flow is pulsatile. In (a) and (b) is shown the pressure in a sealed rigid box (whole body plethysmograph) in which a seated subject is breathholding at resting lung volume with the glottis open. The ECG is also shown. The subject has been breathing (a) air and (b) a mixture of O2 and the highly soluble gas N2O. In (a) there is a slight steady rise of pressure due to warming of the air (the record is inverted and pressure changes have been converted to volume changes by calibration). In addition, there are small pressure oscillations, which are due to such factors as compression of gas by the beating of the heart. In (b) plethysmograph pressure falls in an oscillatory way, with the period being that of the heart cycle. (The arrows indicate where, by venting the plethysmograph, the pressure was restored to atmospheric.) The instantaneous pulmonary capillary blood flow was calculated by point-to-point subtraction of the control from the test record, to obtain the instantaneous rate of uptake of N2O, and by scaling this value by the solubility of N2O in blood at the measured alveolar partial pressure for the gas. Shown in (c) are values of pulmonary capillary blood flow obtained in a normal subject at rest and after exercise. The dotted line represents the mean flow-rate and the ECG is shown. (From Lee and DuBois (1955). 'Pulmonary capillary blood flow in man'. J. clin. Invest 34, 1380-90.)
An approximate theory of quasi-steady blood flow in the alveolar sheet has been developed with the help of some model experiments and some simplifying assumptions, as follows.
(a) In both the theory and the models the blood was treated as a homogenous Newtonian fluid, with viscosity about four times that of water, and the presence of red cells in concentrated suspension was ignored (an analysis similar to the lubrication theory given in Chapter 13 for systemic capillaries, §13.6.1, could presumably be developed in order to assess the effect of red cells, but this has not yet been done);
(b) initially the presence of the posts was ignored;
(c) the thickness of the alveolar sheet, h, was everywhere linearly related to transmural pressure (piv - palv):
h = h0 + g (piv - palv), (15.2)
where g and h0 are constants. This equation has been confirmed by measurements on excised segments of the alveolar sheet in the dog and cat; in these preparations the posts were of course present. The measurements on the dog showed that Equation (15.2) was valid over a range of transmural pressures between zero (or just above) and about 2.5 x l03 N m-2 (25 cm H2O). The 'compliance' g was shown to depend on the transpulmonary pressure, which, as it varies, causes different degrees of distension of the alveolar membrane. For a transpulmonary pressure of 103 N m-2 (10 cm H2O), g has a value of about 1.2 x 10⁻³ mm/N m-2, while for a transpulmonary pressure of 2.5 x 10³ N m-2 (25 cm H2O), g was about 0.8 x 10⁻³ mm/N m-2 (see also Fig. 15.8, §15.2.3). Equation (15.2) breaks down when alveolar pressure exceeds intravascular pressure, for in that case the capillary sheet collapses rapidly from thickness ho to near zero thickness.
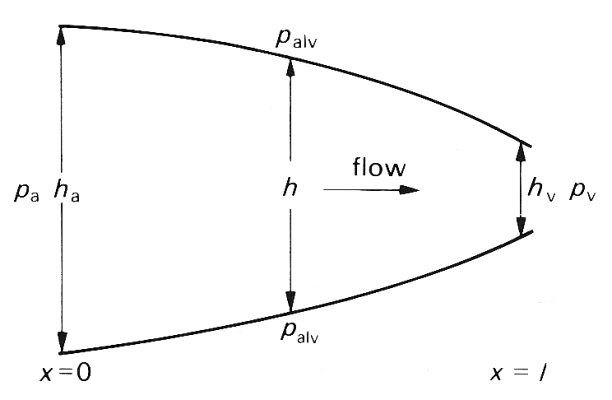
Fig. 15.18. Illustration of sheet thickness and pressure used in the model of sheet flow analysed in the text.
The theoretical analysis of the flow was developed from Equation (15.2) together with the two basic principles governing fluid flow in a narrow space. These are that the pressure gradient is everywhere balanced by viscous forces, and that at any particular time the volume flow-rate must be the same everywhere in the sheet, if the fluid is incompressible and the flow is quasi-steady, since fluid is not destroyed or created anywhere. These are the same principles as those used in the lubrication analysis of red cell motion in systemic capillaries (§13.6.2). The results can best be described in terms of flow in a two-dimensional sheet, as illustrated schematically in Fig. 15.18; there is no variation in the thickness of the sheet or in the flow in a direction perpendicular to the plane of the diagram. The pressure in the sheet (piv is assumed to be given at the arterial and venous ends of the sheet (pa and pv respectively). The pressure outside is the alveolar pressure (palv). The thickness h of the sheet varies with distance x along it, and has the value ha at the arterial end. The main results of the theory are as follows:
(i) If alveolar pressure is less than pulmonary venous pressure (palv < pv < pa), the sheet remains open, and h varies with x according to the following equation:
h4 = ha4 - bx, (15.3)
where b is a term which depends on the values of pa and pv, and on the length l of the sheet in the direction of the flow. This, with Equation (15.2), means that an expression involving the fourth power of piv also varies linearly with x, which is quite different from the case in a straight, rigid tube or sheet, in which it is the pressure itself which varies linearly with distance. In this case the flow-rate Q is directly proportional to bl, and hence (from Equation (15.3))
Q = C (ha4 - hv4), (15.4)
where hv is the thickness of the sheet at the venous end, and C is a constant independent of sheet thickness and of pressure.
(ii) When the sheet remains open everywhere, the resistance to flow through it, equal to the pressure drop divided by the flow-rate, and denoted by R, is given by
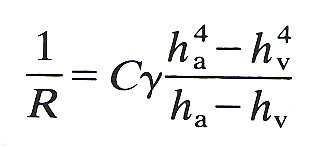 (15.5)
where g and C are the same constants as in Equations (15.2) and (15.4). This result will clearly be affected by the presence of the posts. One way of assessing their effect is to find the factor by which the resistance in a parallel-sided, rigid sheet is increased by the presence of posts, and to apply the same factor to the case of the elastic sheet. In both model experiments and a theoretical study this factor was found to be about 3. In the absence of confirmation in the real alveolar sheet, or in an accurate elastic model of it, this factor should be applied to the resistance determined from Equation (15.5).
(iii) The variation of h with x, described by Equation (15.3), is most rapid at the venous end of the sheet. This is because the rate of change of h with x, dh/dx, is equal to -b/4h3, which is greatest for the smallest values of h, i.e. for the largest values of x. The variation is particularly rapid, at the venous end, if the alveolar pressure is only just smaller than the venous pressure pv, for in that case hv is as small as h0. For only a very small further increase in alveolar pressure, the venous end of the tube will collapse completely, and the flow-rate, Q, will become equal to Cha4, independent of conditions at the venous end. As alveolar pressure increases further, the thickness of the open portion of the sheet decreases and the flow-rate falls, approximately in proportion to (pa - palv)4, from Equation (15.2). Finally, if alveolar pressure exceeds arterial pressure, the flow ceases altogether. This process is very similar to that described in the section on collapsing veins (§14.2), only this time inertia plays no part in the mechanism, and self-excited oscillations are never set up.
It is virtually impossible to measure alveolar sheet thickness in vivo, while blood is flowing, so many of the details of this theory cannot be checked directly. However, the predictions of resistance can be checked at least qualitatively, and the volume of blood in the capillaries can be assessed. This is important, because the prediction that sheet thickness varies most rapidly near the venous end (based on Equation (15.3)) implies that capillary blood volume should be proportional to pa - palv, and be virtually independent of the venous pressure. This is observed experimentally, as mentioned earlier (§15.2.4).
The above analysis predicts that the state of a capillary sheet and the flow through it takes one of three forms, according to the relative magnitudes of pa, pv and palv, as we shall now see.
Zonal distribution of blood flow. It has been recognized for some time that the distribution of blood flow within the lung depends on the relative levels of arterial (pa), venous (pv), and alveolar pressures (palv and some of the evidence will be mentioned later. We have already seen that flow through collapsible vessels, such as veins, is strongly influenced by the local transmural pressure (Chapter 14, §14.4). In the pulmonary capillaries, as in veins, we can distinguish three regimes or zones.
I. If the alveolar pressure exceeds both arterial and venous pressures the bed is closed and there is no flow.
II. If the alveolar pressure is intermediate between the arterial and venous pressures, the bed is partially collapsed and the flow-rate depends on pa - palv.
III. If the venous pressure is intermediate between the arterial and alveolar pressures the sheet is open everywhere and the flow-rate depends on pa - pv
In the normal, upright resting man, all three zones may be found, because there is a hydrostatic gradient of intravascular pressure down the lung, as already described, while alveolar pressure is roughly uniform and close to atmospheric. Thus, near the top of the lung, blood pressure is low and the first condition applies; this is termed zone I. In the middle of the lung, the second condition applies, and the region is called zone II. Finally in the lower part of the lung, zone III, venous pressure exceeds alveolar pressure.* [*Experimental results show that it is actually necessary to distinguish a fourth region, zone IV, which is adjacent to the bottom of the lung. Since flow in this region is greatly affected by lung volume, discussion of it is deferred to §15.4.3.]
Clearly the levels at which the zones merge into one another will vary as alveolar pressure. During positive pressure inflation, more of the lung will be in zone I, while during a rapid voluntary inspiration, palv is less than atmospheric pressure, and zone II is extended. Even more striking changes are to be expected if pulmonary arterial pressure is raised, for example during exercise, or in pulmonary hypertension; then zone II may occupy the whole lung.
The existence of these zones has been confirmed in a number of ways, for example, by observing the number of red cells in the alveolar capillaries in histological sections of dog lungs, frozen rapidly while being perfused at a series of vascular and alveolar pressures (Fig. 15.8). Furthermore, it has been confirmed in isolated perfused lungs and in studies on intact man.
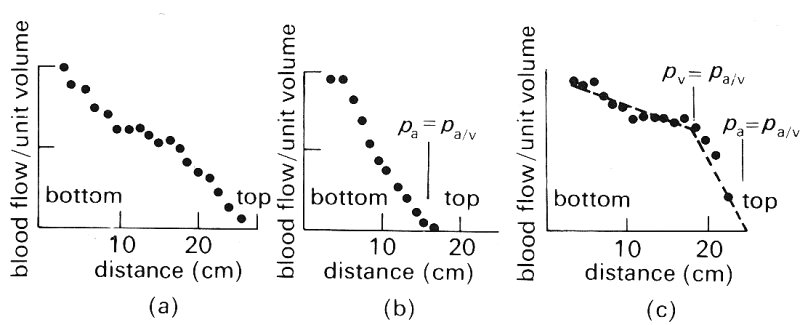
Fig. 15.19. Measurements of the distribution of blood flow in isolated perfused dog lungs by 133Xe (see text). (From West, Dollery, and Naimark (1963). 'Distribution of blood flow in isolated lung: relation to vascular and alveolar pressures'. J. appl. Physiol. 19, 713-24.)
Fig. 15.19 shows the effect on the vertical distribution of the blood flow-rate in an isolated perfused dog lung of varying arterial, alveolar and venous pressures. The blood flow-rate has been measured by using radioactive xenon 133Xe), which is dissolved in saline and injected into the pulmonary artery. When it reaches the pulmonary capillaries it is largely transferred from the blood into the alveolar gas because of the large partial pressure difference and its low solubility in blood. Ventilation is stopped while this is occurring and the lungs are scanned with counters; the amount of radioactivity measured at any station after appropriate calibration reflects the local blood flow-rate.
Fig. 15.19 (a) shows the distribution of blood flow when alveolar pressure is atmospheric and the lung is inflated by a negative pressure of 1 x 10³ N m-2 (10 cm H2O). Arterial pressure is 3.2 x 10³ N m-2 (32 cm H2O) at the bottom of the lung, which is 26 cm tall, and the venous pressure reservoir is below the bottom of the lung, so that the venous pressure is subatmospheric throughout the lung. There is an approximately linear increase in blood flow down the lung, with the flow-rate being almost zero at the top. In Fig. 15.19 (b) the effect on the flow distribution of reducing the pulmonary artery pressure to 1.6 x 10³ N m-2 (16 cm H2O) is shown. Arterial pressure then equals alveolar pressure 16 cm above the bottom of the lung and the flow-rate falls to zero at about this level. In Fig. 15.19 (a) arterial pressure is 2.55 x 10³ N m-2 (25.5 cm H2O), whilst the venous reservoir has been raised 19 cm above the bottom of the lung. In the region where venous pressure exceeds alveolar pressure there is only a gradual increase of blood flow down the lung; while in the upper part of the lung, where alveolar pressure exceeds venous pressure, the gradient is much steeper. From the arguments given above we may see that there is: (i) no flow in zone I (Fig. 15.19 (b)), (ii) a steep increase in flow with distance down the lung in zone II (Figs 15.19 (b) and (c)), (iii) a slight increase of flow with distance down the lung in zone III (Fig. 15.19 (c)). Similar results have been obtained in man.
In order to understand why the blood flow-rate increases with distance down the lung in zones II and III and why the rate of increase is different in the two zones, we must consider what pressure difference determines the blood flow-rate, and what factors determine the pulmonary vascular resistance within each zone.
In zone II the flow-rate is determined by pa - palv (§15.4.2) and since palv is essentially independent of height in the lung, whereas pa increases by about I cm H2O (0.l x 103 N m-2) per cm distance down the lung, the pressure difference causing flow increases by that amount (see footnote §15.4.3). The pulmonary vascular resistance in this zone is determined by the pressure in the pulmonary arteries and capillaries, venous pressure being unimportant. Because the arterial pressure increases down the lung, the arteries can be expected to be progressively distended, according to the local transmural pressure and the vessel elastic properties. Thus the resistance offered by the arteries will also fall with distance down the lung, though the relationship between vessel diameter and resistance cannot be predicted exactly, because of the complicated nature of the flow. The transmural pressure of the alveolar capillaries will also increase with distance down the lung and as a result there will be both an increase in the number of open capillaries and a progressive distension of those that are patent. Both these changes will cause capillary resistance to fall with distance down the lung, and all the vascular changes, coupled with the increase of the pressure determining flow, will cause the blood flow-rate to increase down the lung.
In zone III, the flow-rate is determined by pa - pv (§15.4.2) and since both pa and pv increase by the same amount (about 1 cm H2O per cm distance down the lung) the pressure difference which determines the flow-rate will be independent of height in the lung.* [*This is not precisely true because the distribution of pressures along the vessels of the lung depends on both the arterial and venous resistances, as well as on capillary resistance. Thus the distribution of pressures and the distribution of flow-rates are interdependent.] The pulmonary vascular resistance in this zone is determined by the arteries, capillaries and veins. The comments made concerning the dimensions and resistances of the arteries in zone II also apply to the arteries and veins in zone III, so that the resistance to flow through these vessels and the capillaries can be expected to fall with distance down the lung. In the case of the capillaries the predominant change with distance down the lung is thought to be distension, although so far it has not proved possible to distinguish experimentally between distension and recruitment.
These differences in mechanics between zones II and III offer a consistent explanation for the greater increase of flow-rate with distance down the lung in the former zone. We shall discuss in the next section the effect of lung volume on the relative resistances of the extra-alveolar and alveolar vessels.
Effect of lung mechanics. We have seen above the influence of pleural pressure and lung volume on the mechanics of the extra-alveolar vessels, and of alveolar pressure and lung volume on the mechanics of the alveolar capillaries (§15.2.2). Now we examine the effect of lung mechanics on the distribution of pulmonary blood flow and pulmonary vascular resistance.
The above experimental studies in erect man, which confirm the existence of the zones, were made at fairly high lung volumes. However, when similar studies were made with a somewhat refined technique over the whole range of lung volumes, hitherto unrecognized behaviour of pulmonary blood flow was found, as shown in Fig. 15.20. At total lung capacity a small region is seen near the bottom of the lung where blood flow actually falls with distance down the lung; this becomes larger as lung volume is reduced to functional residual capacity and at residual volume flow in the apical region exceeds that near the base, thus reversing the distribution seen at total lung capacity. It is impossible to explain this behaviour in terms of the simple model described (§15.2.2). It is believed that it is explained by the weight of the lung causing it to be less expanded near the base (§15.2.2) and the raised perivascular pressure of the basal extra-alveolar vessels causing them to be narrowed and to have a raised resistance. Consistent with this explanation is the finding that alveolar volume is relatively uniform in the fully expanded isolated lung.
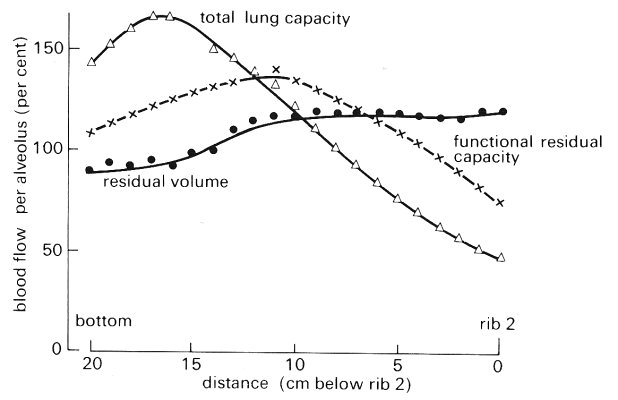
Fig. 15.20. Blood flow per alveolus as a percentage of that expected had all alveoli been perfused equally, plotted against distance down the lung at three lung volumes - total lung capacity, functional residual capacity, and residual volume. Points represent the mean values of the right and left lungs of all subjects studied at that volume. Note the reduction of basal blood flow which is more marked at lower lung volumes. (From Hughes, Glazier, Maloney, and West (1968). 'Effect of lung volume on the distribution of pulmonary blood flow in man'. Respiration Physiol. 4, 58-72.)
Consider next the results obtained when an isolated perfused lung is inflated by an external negative pressure, while maintaining atmospheric alveolar pressure. The differences between arterial and venous pressure and between arterial and alveolar pressure are controlled independently of chamber pressure and lung volume. The blood flow-rate was measured at different values of lung volume and the pulmonary vascular resistance was calculated. As shown in Fig. 15.21, as lung volume was increased pulmonary vascular resistance fell slightly, taking a minimum value when the lung was moderately inflated (100-150 ml). With further inflation of the lung, the pulmonary vascular resistance rose to about twice the minimum value.
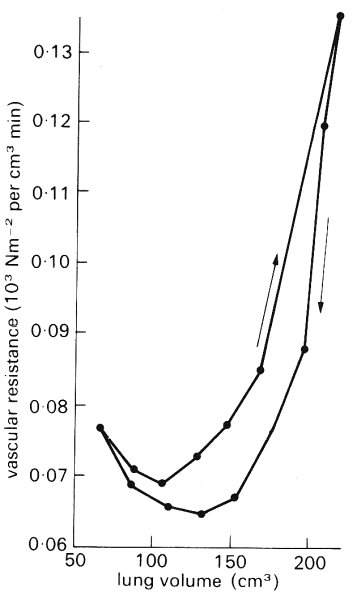
Fig. 15.21. Vascular resistance vs. lung volume. All points were determined under static conditions. Arrows indicate direction of volume change. (From Thomas, Griffo, and Roos (1961). 'Effect of negative-pressure inflation of the lung on pulmonary vascular resistance'. J. appl. Physiol. 16, 451-6.)
We have noted above that inflation of a lung, under these conditions, leads to enlargement of the extra-alveolar vessels. It is believed that the observed fall of pulmonary vascular resistance with increase of lung volume is explained in this way. We have noted, moreover, that an increase of lung volume under these conditions causes compression of the alveolar capillaries, because of the increased tension in the alveolar walls, and it is believed that such a change explains the rise of pulmonary vascular resistance with further increase of lung volume. The implication is that the extra-alveolar vessels make the principal contribution to the pulmonary vascular resistance at small lung volume, and the alveolar vessels at larger lung volume.
We must ask whether these experimental studies are relevant to conditions in vivo. Certainly, in vivo, lung volume is changed by change of pleural pressure, and, just as with the perfused excised lung, alveolar pressure is atmospheric at any static lung volume, provided that the airways are open to the atmosphere. However, the mechanics of the pulmonary circulation in vivo are different from those in the experiment, because both the right ventricle and left atrium are inside the pleural cavity, and are hence exposed to pleural pressure. Actually, this difference is apparent rather than real, because there is continuity between the blood vessels of the pulmonary and systemic circulations. Thus if blood is, for example, displaced from systemic vessels, say by raising the legs, pulmonary arterial and venous pressures rise and pulmonary blood volume, including pulmonary capillary blood volume, increases (§15.2.4). These arguments predict, therefore, that a change in lung volume in vivo will cause a change in pulmonary vascular resistance similar to that seen with the isolated perfused lung. Some experimental observations confirm that prediction, but there is not firm agreement on this point. Possibly this is because the arrangement in vivo is far more complicated than that in vitro, so that, for example, a change of posture can also bring about other changes, such as in the cardiac output.
BANISTER, J. and TORRANCE, R. W. (1960). The effects of tracheal pressure upon flow: pressure relations in the vascular bed of isolated lungs. J. exptl. Physiol. 45, 352-67.
BATES, D. V., MACKLEM, P. T., and CHRISTIE, R. V. (1971). Respiratory function in disease. W. B. Saunders, Philadelphia, London, Toronto.
BENJAMIN, J. J., MURTAGH, P. S., PROCTOR, D. F, MENKES, H. A., and PERMUTT, S. (1974). Pulmonary vascular interdependence in excised doe lobes. J. appl. Physiol. 37, 887-94.
CARO, C. G. (1966) (ed.). 'Mechanics of the pulmonary circulation'. In Advances in respiratory physiology. Edward Arnold, London.
CUMMING, G. (1974). "The pulmonary circulation'. In Cardiovascular physiology. Physiology Series I, Vol. I, pp. 93-122 (ed. A. C. Guyton and C. E. Jones). MTP International Review of Science. Butterworths, London, and University Park Press, Baltimore.
FISHMAN, A. P. (1963). 'Dynamics of the pulmonary circulation'. In Handbook of physiology. Section 2: Circulation. Vol. II (ed. W. F. Hamilton and P. Dow) American Physiological Society, Washington, D.C.
FISHMAN, A. P. and HECHT, H. H. (1969) (ed.). The pulmonary circulation and interstitial space. University of Chicago Press, Chicago and London.
FUNG, Y. C. and SOBIN, S. S. (1972). Pulmonary alveolar blood flow. Circulation Res 30, 470-90.
FUNG, Y. C. and SOBIN, S. S. (1969). Theory of sheet flow in lung alveoli. J. appl. Physiol. 26, 472-88.
HARRIS, P. and HEATH, D. (1962). The human pulmonary circulation: its form and function in health and disease. E. & S. Livingstone, Edinburgh and London.
HOWELL, J. B. L., PERMUTT, S. PROCTOR, D. F., and RILEY, R. L. (1961). Effect of inflation of the lung on different parts of pulmonary vascular bed. J. appl. Physiol. 16, 71-6.
PERMUTT, S., HOWELL, J. B. L., PROCTOR, D. F., and RILEY, R. L. (1961). Effect of lung inflation on static pressure-volume characteristics of pulmonary vessels J. appl. Physiol. 16, 64-70.
SPENCER, H. (1968). Pathology of the lung. Pergamon Press, Oxford.
WEST, J. B. (1974). Blood flow to the lung and gas exchange. Anesthesiology 41, 124-38.