 (14.1)
The study of the mechanics of blood flow in veins has been far less extensive than that of blood flow in arteries. However, virtually all the blood ejected by the left ventricle must return to the right atrium through the veins;* [*Arterial blood supplied to the lungs by the bronchial circulation returns to the left atrium; this is normally a very small fraction (less than 5 per cent) of the cardiac output.] they normally contain almost 80 per cent of the total volume of blood in the systemic vascular system, and have an important controlling influence on cardiac output. It is therefore important to understand their mechanics.
The venous system resembles the arterial system, in that it consists of a tree-like network of branching vessels; the main trunks are the venae cavae, which come together and lead into the heart. However, it is fundamentally different from the arterial system in several respects: (i) as can be seen from Fig. 12.11, §12.2.1, the pressure in a vein is normally much lower than that in an artery at the same level, and may be less than atmospheric (for example in veins above the level of the heart); (ii) the vessels have thinner walls and their distensibility varies over a much wider range than that of arteries at physiological pressures; (iii) the blood flows/row the periphery towards the heart, and the flow-rate into a vein is determined by the arterio-venous pressure difference and the resistance of the intervening microcirculation; (iv) many veins contain valves which prevent backflow. The consequence of these differences is that the distribution of pressure and flow-rate in the venous system is quite different from that in the arteries, although many of the physical factors determining them, for example the transmission and reflection of waves, are qualitatively similar.
This chapter begins by describing the anatomy and arrangement of veins, and goes on to discuss the transmural pressures to which veins are subjected and their elastic response to changes in transmural pressure. Then we discuss the dynamic pressure and flow-rate fluctuations which are observed in veins, describing the physical factors which determine them. A separate section is devoted to the interesting phenomena which may occur when blood flows through a vessel which can collapse; and finally we examine some aspects of the mechanics of the systemic venous system as a whole.
The systemic veins begin at the venules, where the capillaries join together, and end where the venae cavae enter the right atrium of the heart. There are one or two exceptions to this pattern, because in some regions blood flows successively through two microcirculations in series (for example the portal circulation* [*Here, blood from the intestines, spleen, and gall bladder drains into the portal vein, from which it flows directly into the liver, which has its own microcirculation. From here it enters the hepatic vein, and thence passes straight into the inferior vena cava.] or the kidneys), and in others there are arterio-venous anastomoses, which by-pass the capillaries altogether. Nevertheless the system can be represented by a network of vessels which come together and increase in diameter the nearer they are to the heart, while the total cross-sectional area decreases. The venous system has a much greater capacity than the arterial system, both because the number of vessels is greater, and because at a particular level the veins draining a vascular bed tend to be larger than the corresponding arteries supplying it. The greater variability of the capacity of the veins is governed by their greater distensibility together with the mode of action of the muscles in and around their walls.
There is some disagreement about exactly how the blood volume is distributed within the veins, because they are difficult to study. As we have seen in Chapter 13, the vascular beds which have been most widely studied are those which are two-dimensional and run through transparent tissues. An example is the bat's wing; the dimensions and cross-sectional areas of different blood vessels in this circulation are given in Table 12.1 (§12.1.2). It shows that the area increases between the capillaries and the venules, and that the area of the venules exceeds that of the small veins by a factor of 4-6 and of the large veins by a factor of 26. The area of the venules also exceeds that of the arterioles by a factor of about 25. There is of course a less marked difference between the capacities of the venules, small veins and large veins than between their cross-sectional areas, because the smallest vessels are also the shortest.
Rather different results have been obtained, however, from measurements in the dog omentum. Here the total cross-sectional area of the venules is reported to be only about 4-5 times that of the arterioles. It would be desirable to confirm these findings by another method, for example by measuring the blood velocity in the different vessels (as the total cross-sectional area increases, the blood velocity should fall in proportion), but as far as we know no such measurements have been made in either the bat's wing or the dog omentum. However, measurements of blood velocity in the cat omentum are consistent with the relative cross-sectional areas in the dog. The most probable reason for the discrepancy in the area measurements between bat and dog is that the relative dimensions of the venous and arterial systems vary from place to place in different animals.
The walls of veins are much thinner than those of arteries. For example, the ratio of wall thickness to diameter in a vein at a physiological transmural pressure is typically 0.01-0.02, while the corresponding ratio in a large systemic artery is 0.06-0.08 (Table I). Too little is known about the venous bed for us to be able to describe in detail the taper of individual veins, if any, or the area ratios and angles of branching at even the major junctions.
On the basis of their size and of microscopic studies of their wall structure, the veins are classified into five groups: post-capillary venules, venules, small veins, medium veins, and large veins, the last two sometimes being lumped together in a single category. The wall structure of post-capillary venules (diameter 8-30 mm) and of venules (diameter 100-200 mm) was described in detail in Chapter 13, and is briefly summarized here. The transition from capillary to vein is a gradual one, with the connective tissue elements appearing very near the capillary end and smooth muscle cells slightly more proximally. When several capillaries join together, they form the post-capillary venules, about 20 mm in diameter, which consist of a layer of endothelium surrounded by a thin layer of longitudinally directed collagen fibres and fibroblasts. In venules of 40-50 mm diameter, isolated circularly arranged muscle fibres appear between the endothelium and connective tissue. In veins of 200-300 mm diameter, the circular smooth muscle forms a continuous layer and the adventitia becomes thicker, having scattered fibres in addition to the longitudinally disposed collagen fibres. In small veins (up to 0.2 cm diameter), the smooth muscle becomes multi-layered and the individual layers of muscle are separated by loose collagenous tissue. It is at this level that the three characteristic layers of blood vessel walls (intima, media, and adventitia, see §12.1.3) are first apparent; thereafter the structure of veins is similar to that of arteries. The main differences are that the media is very much thinner, and the adventitia, composed principally of collagen fibres, comprises the bulk of the wall. Also the internal elastic lamina is poorly defined. Veins in parts of the body normally below the heart, such as the lower limbs, tend to have relatively thick media, though whether this is because they experience a relatively high transmural pressure is unknown.
The walls of veins with a calibre greater than about 0.1 cm have vasa vasorum. These originate from nearby small systemic arteries, and run in the adventitia, forming a profuse capillary network which extends through the thickness of the wall almost to the intima, and connects with venules in the adventitia. Veins are well supplied with nerves, entirely derived from the sympathetic system. The smooth muscle in the walls of veins is normally in a state of active tension (i.e. of tone). Cutting of the nerves, or the inhibition of nerve activity with drugs, causes veins to dilate, because the tension in the wall is reduced. This dilation may considerably increase the cross-sectional area of a vein.
Many medium-sized veins, especially those in the limbs, are provided with valves, which act to prevent blood from flowing backwards. (In man, there are no valves in the veins which drain the abdominal viscera, except the portal vein, or in the venae cavae.) The valves usually have two cusps which consist of connective tissue membranes containing elastin fibres and covered with endothelium. Adjacent to each cusp on the downstream side (the side nearer to the heart) there is usually a sinus, i.e. an outpouching of the wall. This presumably has the same mechanical function, of ensuring stable opening and smooth closing of the valve, as the sinus of Valsalva behind each cusp of the aortic valve, whose mechanics were described in §11.5.2. Detailed studies of the operation of venous valves have not been made.
At the level of the heart in a supine subject the mean pressure within veins, relative to atmospheric, varies from about 2.0 x 10³ N m-2 (20 cm H2O) in the venules to about one third of that value in the venae cavae, although pressures within the chest can be sub-atmospheric because of respiratory pressure swings (see Fig. 14.20). The difference between these pressures is responsible for driving the mean flow through the veins back to the heart. Since the pressure outside a vein is normally about atmospheric, these are also the values of the transmural pressure tending to distend the veins. If the subject becomes upright, the excess pressure above hydrostatic (pe, see §12.2.1) which drives the mean flow remains virtually the same, but the transmural pressure remains the same only at the level of the heart. The veins of the foot will fill from the microcirculation, until the internal pressure has increased by about 104 N m-2 (the hydrostatic pressure due to a 1 m column of blood), while in those of the neck or a raised arm it is significantly reduced, and becomes sub-atmospheric. As we shall see, it is possible to reduce the distending transmural pressure of veins in the dependent limbs by contracting the skeletal muscle around them and thereby increasing the external pressure; this has the effect of reducing their cross-sectional area and hence their capacity, the blood being displaced towards the heart. The veins above the heart are commonly collapsed (see §12.2.1), and cannot be opened by muscular action.
Thus the physiological range of cross-sectional area and shape of a vein is far greater than that of an artery, whose circular cross-section changes its area by a relatively small amount when subjected to the same variation in transmural pressure. The possibility of collapse has a number of important mechanical consequences, which are explored in the next three sections. Here we describe, as far as they are known, the changes in cross-sectional area, shape and distensibility of a vein which follow gradual changes of transmural pressure (in the physiological range). All the quoted measurements have been made on excised segments of large veins held at their physiological length but without tone. In vivo the response will be quantitatively rather different because contraction of the smooth muscle renders a vein less distensible, although it does not greatly alter its resistance to collapse because the walls are so thin.
The data are best presented by means of Fig. 14.1, which has been constructed both from measurements and from inferences which can be made from them. This figure summarizes what is known of the static behaviour of veins, and is of central importance in the rest of the chapter. The curves are not direct recordings of measurements from a single segment, and should be regarded as a schematic representation. A number of quantities are plotted against transmural pressure ptm. From top to bottom these are:
(a) The change in cross-sectional area (A - A0) measured as a fraction of the cross-sectional area at zero transmural pressure (A0); this is a dimensionless measure of the area change, and can be used to compare results from different vessels. For transmural pressures between ±2 x 10⁻³ N m-2, this curve was taken from direct measurements on the vena cava of a dog.
(b) A similar ratio for the perimeter l of the cross-section. The central section of the curve (between ±0.5 x 10³ N m-2) was plotted from the data of Fig. 14.2 (b) (§14.2) and (a) above; the section for transmural pressures greater than 1.5 x 10³ N m-2 was taken from Fig. 14.3 (a) (§14.2); the rest was drawn in to give a smooth fit.
(c) The ratio between the lengths of the major and minor axes of the cross-section, a/b; the cross section is observed to become elliptical when it first ceases to be circular, but during the final stages of collapse it is not elliptical, and therefore this ratio is not defined. This curve was taken from a number of measurements.
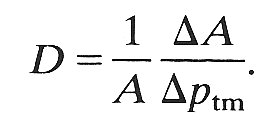
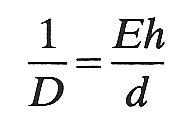
(d) and (e). Two quantities, each of which is a measure of the distensibility of the vessel. In §12.1.2 the distensibility was defined as the relative change in area (DA/A) resulting from a small change in transmural pressure (Dptm). i.e.
(14.1)
D measures the ease with which a change in transmural pressure causes a change in cross-sectional area: a vessel with a low distensibility is very stiff, and vice versa. It is this definition of distensibility which is used in the equation for the speed of propagation of pressure waves (Equation (12.9), §12.3.2). In the case of arteries, the cross-sectional area does not change very much as the transmural pressure varies over the physiological range. Thus only a small error is introduced if the area A in the denominator of Equation (14.1) is replaced by a fixed area, for example that at a distending pressure of 13.3 x 10³ N m-2 (100 mm Hg); this is commonly done because it is more convenient. In the case of veins, however, a considerable error is introduced if A is replaced by a fixed area, because the area varies greatly over the physiological range of pressures. Nevertheless, some workers use the fixed area at zero transmural pressure (A0) in place of A, and thus record a pseudo-distensibility D0, defined by
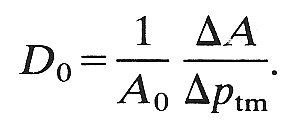 (14.2)
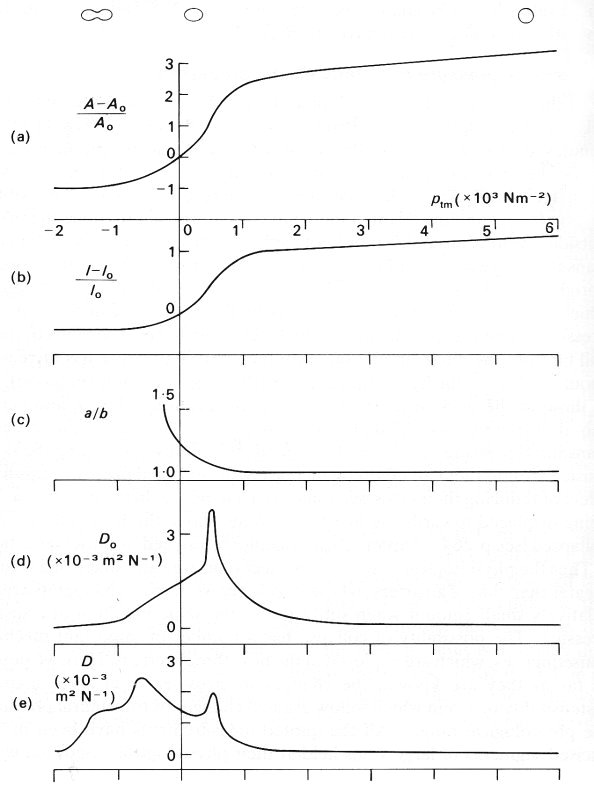
Fig. 14.1. A sequence of graphs illustrating the elastic properties of a segment of vein. The abscissa in each case is the transmural pressure ptm, measured in units of 103 N m-2 (each unit = 10 cm H2O). The ordinates are:
(a) the change in cross-sectional area (A - A0) measured as a fraction of the cross-sectional area at zero transmural pressure (A0);
(b) the change in perimeter (l - l0) measured as a fraction of the perimeter at zero transmural pressure (l0);
(c) the ratio between the lengths of the major and minor axes of the cross-section, a/b, defined only while it remains circular or elliptical;
(d) the 'pseudo-distensibility' D0, defined by Equation (14.2) and equal to the slope of graph (a);
(e) the actual distensibility D, defined by Equations (14.1); the maximum at a transmural pressure of +0.5 x 10³ N m-2 is associated with the maximum in the slope of curves (a): the maximum at a negative transmural pressure is a consequence of the very small values of A.
Above curve (a) are sketches to illustrate the shape of the cross-section at values of transmural pressure corresponding to the position of the sketches. (Parts of data from Moreno, Katz, Gold, and Reddy (1970). 'Mechanics of distension of dog veins and other very thin-walled tubular structures', pp. 1069-1079, Circulation Res. 27, by permission of the American Heart Association Inc.; and from Attinger (1969). 'Wall Properties of Veins', pp. 253-261, Trans. on Bio-med. Eng. BME-16, Institute of Electrical and Electronics Engineers Inc., New York.)
To show the considerable difference between the two distensibilities, we plot D0 and D on Figs 14.1(d) and 14.1(e) respectively. Both curves are plotted from measured slopes of the area curve in Fig. 14.1 (a). It is the lower distensibility curve, Fig. 14.1 (e), which should be regarded as the more useful
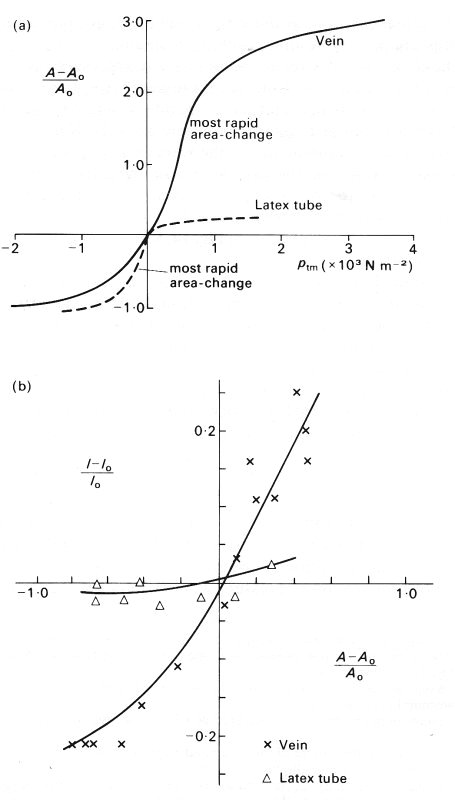
Fig. 14.2. (a) Pressure-area relationships for a segment of vein and a thin-walled latex tube: area expressed as a fractional area change as in Fig. 14.1 (a); pressure expressed as transmural pressure pin,. Each vessel has an internal diameter of 1.2 cm, and a wall thickness to diameter ratio h/d of approximately 0.04, but the latex tube had a Young's modulus 40 times that of the segment of vein.
(b) Fractional change in perimeter plotted against fractional change in area for the vein and the latex tube. (After Moreno, Katz, Gold, and Reddy (1970). 'Mechanics of distension of dog veins and other very thin-walled tubular structures'. Circulation Res. 27, 1075, 1076 and 1079, by permission of the American Heart Association Inc.)
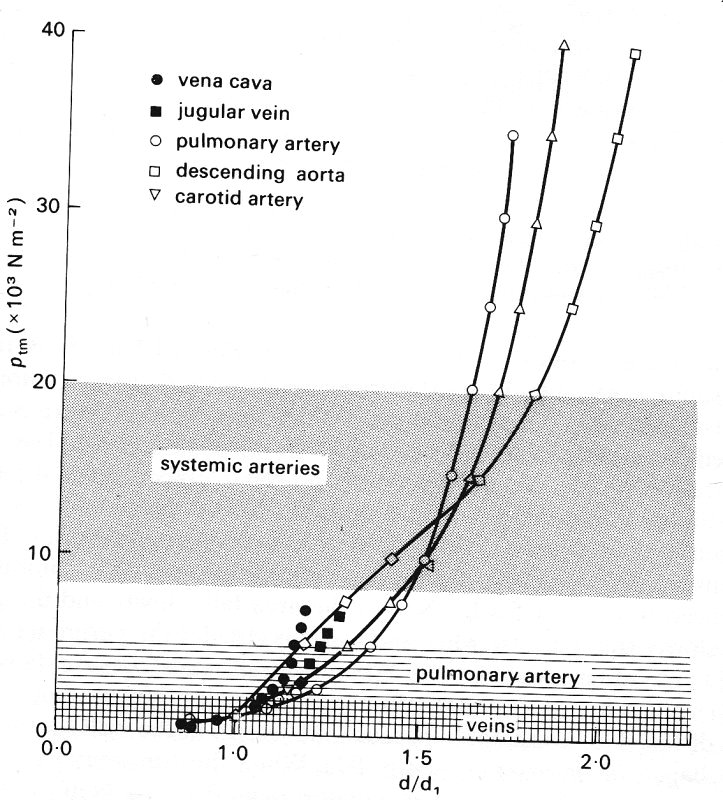
Fig. 14.3. (a) Relationship between diameter and transmural pressure ptm for different vessels of a dog (diameter d is scaled relative to the diameter d1 at a transmural pressure of 103 N m-2 = 10 cm H20). The shaded areas indicate the normal physiological range of transmural pressures for systemic arteries, pulmonary arteries, and veins at the level of the heart.
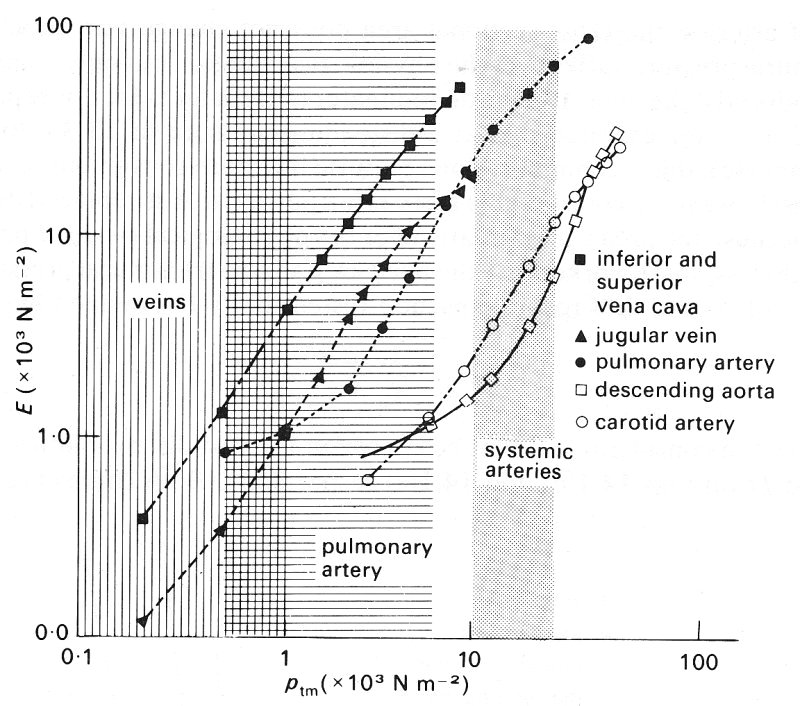
Fig. 14.3. (b) Dependence of effective incremental Young's modulus E on transmural pressure ptm, tor various vessels. Shaded areas as in (a). (After Attinger (1969). 'Wall properties of veins', pp. 257-258, Trans. on Bio-med. Eng. BME-16, Institute of Electrical and Electronics Engineers Inc., New York.)
Consider what happens to the vein as the transmural pressure is gradually reduced from a high value of more than 7 x 10³ N m-2 (70 cm H2O). At this pressure the vein is circular (a/b = 1), and relatively stiff since it has a small distensibility and a large Young's modulus. This is presumably because the collagen in the wall dominates its response to changing pressures. The vessel remains circular, with little change in distensibility, as the transmural pressure is reduced to about l.5 x 103 N m-2; the area falls slowly and the perimeter more slowly still (because while the vessel is circular the perimeter is proportional to the square root of area). When the transmural pressure falls from 1.5 to 1.0 x 10³ Nm-2, the vessel still remains circular, but becomes somewhat more distensible, presumably because the elastin in the wall takes over from the collagen (as in arteries; see §7.2). When the transmural pressure falls below about 103 N m-2 (but is greater than 0.5 x 10³ N m-2), the vessel becomes slightly elliptical, the area falls more rapidly, and the distensibility continues to rise. The perimeter also continues to fall, although it is no longer exactly proportional to the square root of area because the cross-section is not circular, and it is this reduction in perimeter, not the change in cross-sectional shape, which makes the larger contribution to the reduction in area and hence to the distensibility. As the transmural pressure falls to 0.5 x 10³ N m-2 and below, the cross section becomes markedly elliptical, and now the change in shape makes an increasing contribution to the area change and distensibility. The distensibility has a maximum at a transmural pressure of 0.5 x 10³ N m-2, associated with the rapid change in cross-sectional area. The slope of the area curve, and hence the pseudo-distensibility D0, continue to fall thereafter, because it becomes increasingly difficult to bend the vessel wall at its point of maximum curvature (see below). Such bending has to occur before the final collapsed state is achieved at a negative transmural pressure between -1 and -2 x 10³ N m-2 (-10 to -20 cmH20). Because the cross-sectional area becomes extremely small as the vessel collapses, the actual distensibility D has another maximum at a transmural pressure of about -5 x 10³ N m-2, before falling in an irregular way to a very low value again in the final collapsed state. (Because data are so sparse, some of the irregularities in this curve may reflect inaccurate measurements of the small area and of the slope of the area curve.)
During the last stages of collapse, the perimeter scarcely changes at all. After the final stage is reached, the cross section has a dumb-bell shape, with two small, almost circular channels separated by a completely flattened portion of tube. There is some histological evidence that the inner surfaces of vessels become corrugated as they collapse, and the small side channels may become completely blocked. It is important to bear in mind that the whole of the collapse process for veins takes place at values of transmural pressure between about -103 N m-2 and +103 N m-2, which are in the middle of the physiological range.
Measurements of the elastic properties of blood vessels are often expressed in terms of an effective incremental Young's modulus E for circumferential stretch. When vessels are circular, E is related to the distensibility and the wall thickness-to-diameter ratio h/d through the equation
 (14.3)
(cf. Equation (7.3b), §7.2). This shows how a vessel with a large Young's modulus can be very distensible if its walls are sufficiently thin. Use of the Young's modulus in this way is inappropriate when the vessel cross-section is not circular, because it varies around the cross-section. However, the Young's modulus is still important in determining the ease with which a vessel may collapse, as we shall see, and if two tubes of similar dimensions have different Young's moduli, their behaviour during collapse is different. For example, it is important not to generalize about the behaviour of a vein from observations on a rubber tube of similar diameter and wall thickness. Rubber has a Young's modulus of about 2.l x 106 N m-2, while a typical value for a vein when its cross-section is circular (derived from Equation (14.3)) is about 5 x 10⁴ N m-2.
The difference in behaviour between the two types of tube, as the transmural pressure is reduced from more than +2 x 10³ N m-2 to less than -103 N m-2, is illustrated in Fig. 14.2. Fig. 14.2 (a) shows the pressure-area relationships of the two types of tube, and Fig. 14.2 (b) shows the relationship between area and perimeter. The maximum area of the latex tube at high values of transmural pressure is much smaller than that of the vein, and the latex tube is much less dtstensible. The latex tube remains circular until the transmural pressure falls almost to zero, and then starts to become elliptical and then dumb-bell shaped, just like a vein. However, during collapse, the perimeter of the latex tube remains almost constant, and the area change is associated solely with change of shape. Furthermore, the maximum rate of change of area of the latex tube occurs at a negative value of pim (about - 0.25 x 10³ N m-2), whereas that of a vein occurs at a positive value (about +0.5 x 10³ N m-2). It can also be seen that the slope of the graph in Fig. 14.2 (a) (i.e. the pseudo-distensibility) changes much less abruptly for a vein than for a latex tube. This is because the change in perimeter in a vein continues to contribute to the area change even after the shape has begun to alter.
We shall see in the next chapter that pulmonary arteries and veins, which are thin-walled, flexible vessels, like systemic veins, exhibit behaviour similar to that of veins (and not latex tubes) at small but physiological values of transmural pressure. It is of interest to compare the elastic behaviour of the three main types of large blood vessel which have been studied: a systemic vein, a pulmonary artery, and a systemic artery. Such a comparison is provided for the vessels of a dog in Figs 14.3 (a) and 14.3 (b), which show measurements made in vessels in a pressure range where their cross-sections remained circular. Fig. 14.3 (a) shows the diameter of the vessel, relative to the diameter at a transmural pressure of 103 N m-2 (10 cm H2O), plotted against distending pressure. The slopes of these curves, converted into values of an effective incremental Young's modulus of the vessel wall (related to distensibility by Equation (14.3)), are plotted in Fig. 14.3 (b). The shaded areas of the two graphs indicate the physiological range of transmural pressure to which the vessels are normally subjected. If these results are representative of such vessels in general, two deductions can be made:
(i) In their normal pressure range, pulmonary arteries have a similar Young's modulus to systemic arteries, although they are about seven times as distensible because of their smaller thickness to diameter ratio (Table I); systemic veins are about three times as distensible as pulmonary arteries, because the Young's modulus is about one third of that of the pulmonary artery, while h/d is similar.
(ii) However, at equal values of transmural pressure, thoughout the whole range of studies, veins are stiffer than pulmonary arteries, which in turn are stiffer than systemic arteries. These results may reflect the fact that the sharp increase is stiffness associated with the increasing importance of collagen at high transmural pressures comes into effect at about the upper end of the normal operating range. We have already seen in the discussion of arteries (§12.2.1) that progressively greater area changes will follow equal increments of transmural pressure unless the vessel becomes progressively stiffer in this way. The pressure required to burst a vein is very much greater than the normal transmural pressure, being about 5 x 10⁵ N m-2 (5 atm), as was shown as early as 1733 by the English clergyman Stephen Hales (1677-1761) during one of his many experiments on the systemic circulation of animals.
Since the wall is incompressible, it must become thinner as the vessel is distended. Quantitative data for medium-sized and large veins and other vessels are given in Fig. 14.4. This shows that the ratio of wall thickness to vessel diameter h/d falls towards a constant value of about 0.01-0.02, which is a small fraction of the comparable value in a systemic artery.
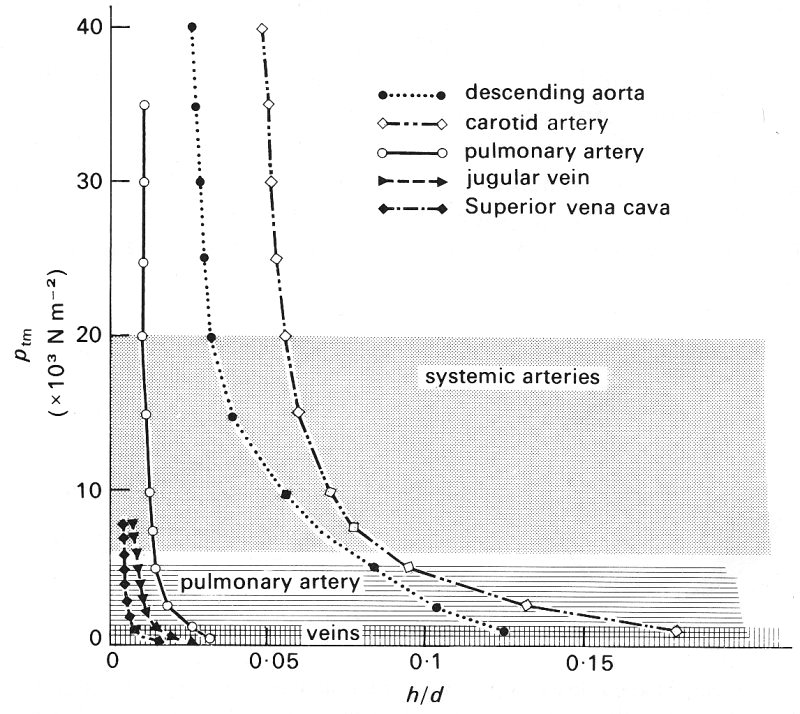
Fig. 14.4. Relationship between wall thickness: diameter ratio h/d, and transmural pressure ptm, for various vessels. Note the large changes in this ratio for low distending pressures. Shaded areas as in Fig. 14.3. (After Attinger (1969). 'Wall properties of veins', p. 257, Trans. on Bio-med. Eng. BME-16, Institute of Electrical and Electronics Engineers Inc., New York.)
All the above information was obtained from excised segments of large veins; factors which might affect the relationship between distensibility and transmural pressure in vivo are tone and the presence of surrounding tissue. However, very little information is available because it is very difficult to measure the transmural pressure and shape of veins. We know that large systemic veins can become non-circular in cross section under physiological conditions; this has been shown with bi-plane X-rays of a vein in the calf muscles of erect human subjects. The X-rays were taken after the local intravenous injection of a radio-opaque dye, first with the leg immobile and a venous transmural pressure of about 7 x 10³ N m-2, and secondly with this pressure greatly reduced by a contraction of the calf muscles (which squeezes out the blood, see §14.5.2). In the former case the average values for the two diameters of the vein were 0.61 cm and 0.47 cm and in the latter 0.15 cm and 0.06 cm. It has not been established whether small systemic veins become significantly non-circular at low values of transmural pressure.
14.2.1 The resistance to bending of a tube wall. It is clear that the bending of the wall is an important feature of the behaviour of blood vessels at low values of transmural pressure, and we have seen that there are significant differences in behaviour between veins and rubber tubes of similar dimensions. For an explanation of these differences we require an understanding of the mechanics of the bending process. To achieve this, we may suppose that the tube bends in the same manner throughout its length, so that it is only necessary to consider a single slice of the tube, forming a thin ring-shaped element (Fig. 14.5 (a)). The thickness of the ring in the radial direction is h; we let the breadth of the slice in the axial direction be b. When the ring begins to buckle under a compressive transmural pressure, it will take up a configuration like that shown in Fig. 14.5 (b); the greatest curvature occurs at the ends, A.
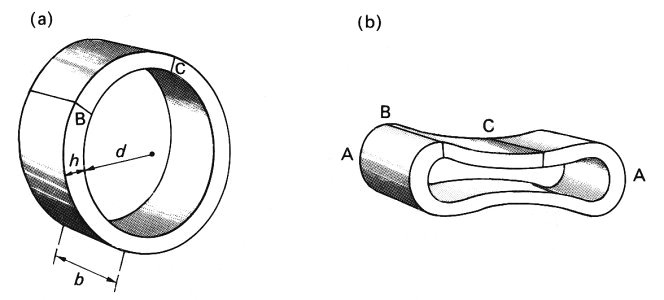
Fig. 14.5. (a) A ring-shaped slice of a tube wall. Internal diameter d, wall-thickness h, breadth of slice in axial direction b. BC is an element of the ring which can be regarded as approximately straight, but whose length is much greater than b or h.
(b) Illustration of the cross-section of the slice after compression has caused it to collapse. The bending moment is greatest and the radius of curvature smallest at the ends, A.
Once the ring ceases to be circular, it becomes very complicated to analyse exactly. However, it is possible to treat it approximately by considering an element of it (BC) which is short enough to be regarded as almost straight, but still long enough that the dimensions of its cross-section (h and b) are small compared with its length. Such an element resembles a beam of uniform cross-section, and we can apply to it a simple theory for the bending of a uniform beam, supported at one end (Fig. 14.6 (a)). The compressive forces on the tube wall can be represented by a downwards force distributed uniformly along the beam, causing it to bend. An even simpler (but equivalent) situation is that of a point force acting on the beam (Fig. 14.6 (b)). The amount of bending will depend on both the magnitude of the force F and the distance x of its point of application from the point of support. In fact it depends on the moment of the force about the point of support, Fx, called the bending moment. (The bending moment generated at the support by a distributed force of magnitude P per unit length is 1/2PL2, where L is the length of the beam.)
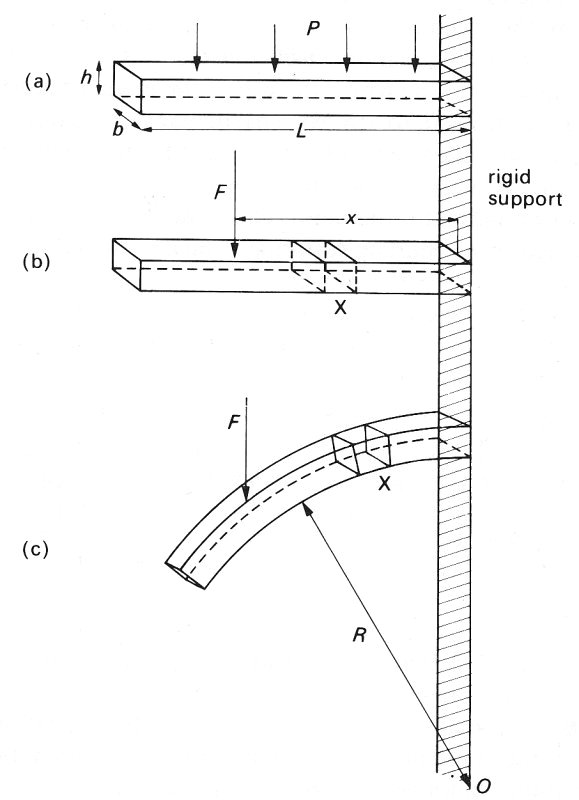
Fig. 14.6. A straight beam of length L, thickness h, and breadth b, supported at one end, and caused to bend by forces acting down on it. (a) Beam shown before bending. A force P distributed uniformly along its upper surface: the bending moment at the support = 1/2PL2.
(b) Beam shown before bending. A point force F exerted at a distance x from the support: bending moment = Fx. Note the undistorted element X. (c) Beam shown after bending. The element X has been distorted, being stretched at the top and compressed at the bottom. Radius of curvature R.
Consider a small element of the beam, marked X in Fig. 14.6. As the beam bends, the top of the element is stretched relative to the centre line, and the bottom is compressed (Fig. 14.6 (c)). Thus the ease of bending depends on the ease with which the material of the beam can be stretched and compressed, as characterized by the Young's modulus E (§7.1). Furthermore, for a given value of E, the beam will bend more easily for smaller values of the thickness h; this is because the amount by which the top of the element must be stretched, and the bottom compressed, to achieve a particular radius of curvature (R, Fig. 14.6 (c)) is less if h is small. The resistance to bending also depends on the width b of the beam but this is less important. These factors can all be expressed by means of a single equation for the radius of curvature, R, which is a convenient measure of the degree of bending resulting from a particular bending moment
 (14.4)
This equation tells us that the amount of bending is proportional to the bending moment, and inversely proportional to the Young's modulus E. It is also inversely proportional to a constant I, which depends only on the geometry of the beam's cross section (i.e. on its depth h, and breadth b). In the case of a rectangular beam, I is given by
I = 1/12 bh3 (14.5)
which shows, as expected, that h is much more important than b in determining the resistance to bending.
These results may be applied qualitatively to the bending of a tube wall. In this case the bending moment at any point in the cross section is proportional to the magnitude of the compressive transmural pressure, but also depends on the local curvature; it is in fact greatest at the ends of the major axis of the cross-section where the radius of curvature is smallest (the points A in Fig. 14.5 (b)). The difference in behaviour between the vein and the latex tube, illustrated in Fig. 14.2, is not surprising in view of Equation (14.4). The Young's modulus of the latex tube was 40 times that of the vein (2.1 x 10⁶ N m-2 compared with 5 x 10⁴ N m-2), while the wall thickness and the undisturbed diameter were the same. Thus the product El was 40 times greater in the latex tube. This explains both its greater resistance to bending, exemplified by the fact that it remains circular until the transmural pressure has become negative, and its smaller distensibility while the cross section is circular. It is also responsible for the fact that, once bending has begun, the perimeter of the latex tube does not change, while that of the vein continues to fall. A detailed explanation of the final development of the dumb-bell configuration is extremely complicated. One simple conclusion which can be drawn is that the tube cannot close off completely, since that would imply zero radius of curvature at the ends of the cross-section and hence infinite bending moment (Equation (14.4)). In practice they may be effectively closed by corrugation of the inner surface.
As in an artery, the pressure and flow-rate in a vein vary with time, and since veins are distensible pressure waves will propagate along them. We have already dealt at length with the propagation of pressure waves through elastic vessels (Chapter 12), and in this section we extend the discussion to take account of the special properties of veins: their thin walls, great distensibility, and valves. In order to confirm theoretical predictions of wave propagation along veins, and to predict flow patterns within them, it would be desirable to have experimental measurements of how the pressure distribution varies throughout the venous system. We have already seen examples of the pressure wave form in a venule (Fig. 13.19, §13.4.1), and that in the vena cava (Fig. 11.29, §11.5.1), so that we can calculate the total pressure drop across the venous system, but there are very few measurements in between. There is even less information on the flow-rate wave-form. This limited amount of data is presented below, but is not sufficient for as complete a description of the unsteady pressures and flows in veins as that given for arteries in Chapter 12. Furthermore, only a brief discussion of the velocity patterns to be expected in veins is feasible.
There are several possible sources of unsteadiness of the pressure and flow in veins. These include (i) the arterial pulse, transmitted to the venules through the arterioles and capillaries, where it is highly attenuated (§13.4.2); (ii) contractions of the right heart, transmitted peripherally against the direction of the flow in the large veins; (iii) respiratory manoeuvres, which can influence venous flow drastically because of the swings in extravascular pressure within the thorax; (iv) the action of muscles near which the vein passes. Very large amplitude oscillations may be developed with abnormal conditions of the heart, such as incompetence of the tricuspid valve and heart block (§14.3.2). Self-excited oscillations may occur also; they are discussed separately in §14.4.2 because of their unusual mechanical properties.
14.3.1 Observed pressure and flow-rate wave-forms. The pressure wave-forms measured at four stations between the right atrium and the brachial vein in man are shown in Fig. 14.7. The measurements were all made within a short space of time, so it may be assumed that they correctly represent the way the shape of a particular wave changes with distance along this venous pathway. The oscillations in the superior vena cava are very marked, with an amplitude of about 700 N m-2, and the wave-form is almost identical to that in the right atrium; there can be no doubt that they are derived from the pulsations of the right heart. A somewhat modified and considerably attenuated wave-form, with an amplitude of about 250 N m-2, is found in the subclavian vein. Here a definite phase lag can be seen because the peak pressures occur later than in the vena cava. This indicates that a pressure wave is propagating peripherally (its speed has not been calculated because the distances involved are not known). A further change in shape is found in the axillary vein, where some of the high frequency oscillations are absent. A dramatic change occurs as the pressure-measuring catheter is withdrawn along this vein, which is almost certainly related to the presence of a valve (see below). In the brachial vein the oscillations have only a very small amplitude, less than 100 N m-2. However, we have already seen (Fig. 13.19, §13.4.1) that there are pressure oscillations in the venules of the cat mesentery, with an amplitude of about 400 N m-2, which is about thirty times less than that in a systemic artery. It was demonstrated in Chapter 13 (§13.4.2) that these are almost certainly the remains of the arterial pulse after attenuation in the arterioles and capillaries. Larger oscillations of this sort can be found in small peripheral veins under certain conditions, for example when the arterial pulse has a particularly large amplitude as in patients with severe aortic valve incompetence; the attenuation in the microcirculation is then not sufficient to suppress the pulse so completely.
It should be emphasized once more that the wave-forms plotted in Fig. 14.7 were recorded at different sites along one particular pathway. The distributions of pressures along different pathways are likely to vary much more than in arteries. There are two reasons for this: one is the distribution of valves along the venous pathways, which as we shall see are expected to have a strong influence on the pressure pulse, and the other is the fact that the veins along some pathways are likely to be in a collapsed state, depending upon their transmural pressure. These veins will have a different distensibility, and hence wave-speed, from those which remain fully open, and will also be a potent cause of wave reflection.
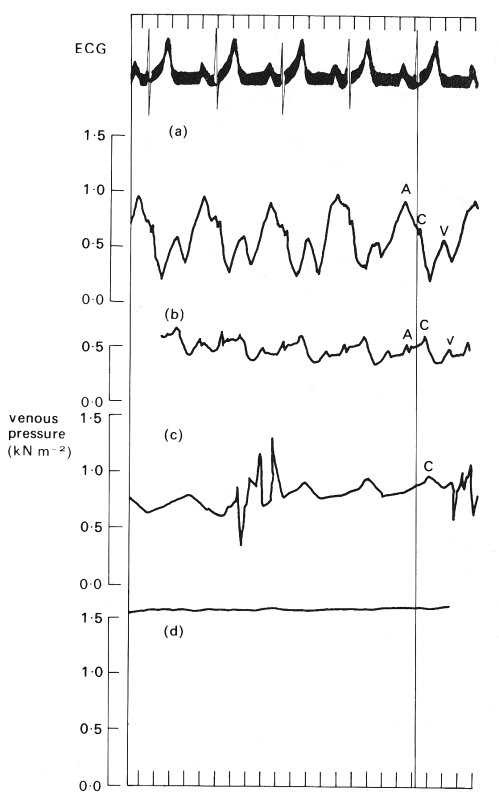
Fig. 14.7. The pressure wave-form measured sequentially with a single catheter at four successive sites in the human venous system. These sites are, from top to bottom: the superior vena cava, the subclavian vein, the axillary vein, and the brachial vein. The pressures were measured relative to atmospheric pressure; the subject was supine so that all sites were at approximately the same level. Note the difference in mean pressure between the four sites. The four wave-forms are aligned with the ECG record (top trace), so that the phase difference between the vena cava and the subclavian vein can be seen. The 'a', 'c', and 'v' pressure waves are also shown in Fig. 14.8 and are discussed in the text in relation to it. (By courtesy of Dr. G. Miller, Brompton Hospital, London.)
Data on the velocity wave-form in the venae cavae of a man are presented in Fig. 14.8 which shows that in each cardiac cycle there are two main oscillations of flow velocity, completely out of phase with the pressure oscillations. At the time of atrial contraction, corresponding to the 'a' wave in the right atrial pressure trace, the velocity of blood in the vena cava is greatly reduced and there may even be momentary flow reversal. Thereafter vena caval blood velocity rise, maintained throughout the 'c' wave and ventricular contraction. The peak velocity occurs during ventricular systole. A second increase in velocity occurs early in ventricular diastole, during the 'y' descent of the atrial pressure, which follows the 'v' wave when the atrio-ventricular valves open.
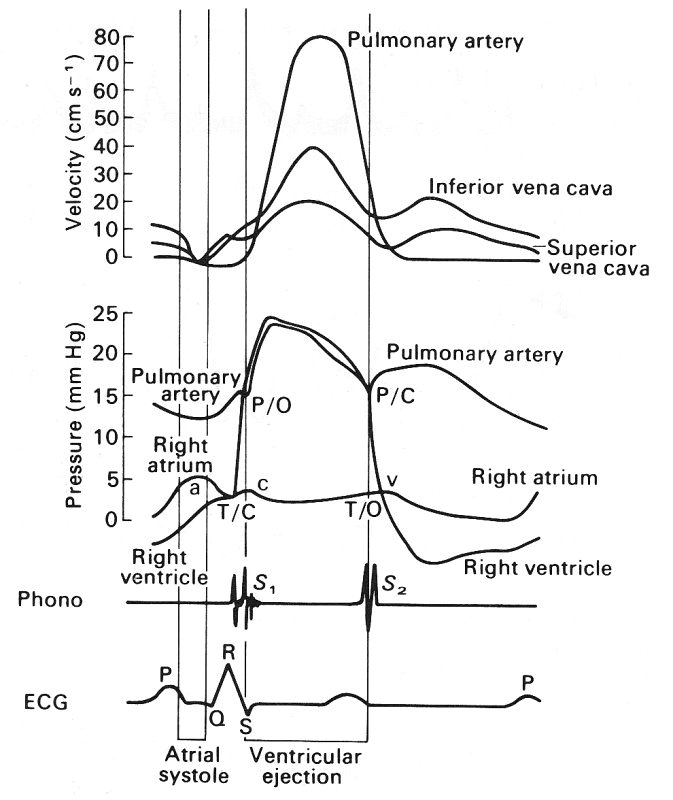
Fig. 14.8. A composite diagram of pressure and velocity of flow into and out of the right heart, constructed from a number of different measurements. The top curves show the velocities in the venae cavae and the pulmonary artery, then come the pressures in the right heart and pulmonary artery, and then the phonocardiogram and ECG. These are included to serve as timing references. T/C = tricuspid valve closed; P/O = pulmonary valve open; P/C = pulmonary valve closed; T/O = tricuspid valve open. (From Wexler, Bergel, Gabe, Makin, and Mills (1968). 'Velocity of blood flow in normal human venae cavae', Circulation Res. 23, p. 352. By permission of the American Heart Association Inc.)
Even larger oscillations can be generated if there is leakage of the tricuspid valve, or if the impulse conduction in the heart is defective (so-called heart-block) so that the atrium contracts during ventricular systole, while the atrio-ventricular valves are closed. Velocity wave-forms have not yet been measured in more peripheral veins.
14.3.2 Wave propagation in veins. Very few experiments have been performed in which the pressure pulse has been recorded simultaneously at two sites in the large veins. Thus there are few observations of the speed of propagation and rate of attenuation of the pulse along the veins. Those observations which do exist show a wave-speed of between 0.5 m s-1 and 3.0 m s-1 in the superior vena cava of a dog; almost as much variation was found within single animals, according to which part of the pulse was recorded. This variation was presumably related either to the variation in venous pressure as the wave passed (see §12.5), or to the presence of reflections, which alter the apparent wave-speed (see §12.3.4). We have only two further sources of information: (i) prediction, based on the knowledge of the mechanics of wave propagation as derived from a study of arteries, and (ii) a single series of experiments on the abdominal vena cava of a dog in which a short train of artificial high frequency sinusoidal pressure waves was generated at one location in the vessel and the pressure recorded at another. As in the similar experiments in arteries (§12.5), measurements were made before the first reflected waves had time to return to the point of observation from the nearest reflection site.
The approximate theory outlined in Chapter 12, §12.3.2 predicts that small amplitude pressure waves in an elastic tube should be propagated with speed c given by Equation (12.9), i.e.
c = (rD)l/2 (14.6)
where r is the density of blood and D is the distensibility of the vessel, given by Equation (14.1). Now the distensibility of the thoracic vena cava of a dog has maximum values of 2-2.5 x 10⁻³ m2 N-1 at distending pressures of ±0.5 x 10³ N m-2 (Fig. 14.1 (e)), with a much smaller value at large values of transmural pressure (the distensibility is about 4 x l0-5 m2 N-1 when ptm = 3 x 10³ N m-2, and falls as ptm rises further). Also at very negative values of transmural pressure the distensibility becomes very small, equal to 10-4 m2 N-1 when ptm= -2 x 10³ N m-2. The density of blood is about 103 kg m-3, so the predicted value of the wave-speed varies from 5 m s-1 or more at high transmural pressures, to a minimum of about 0.6 m s-1 when the vein is collapsing, and increases again to about 3 m s-1 when it is fully collapsed.
Another prediction can be obtained from the data of Figs 14.3 (b) and 14.4. The values of Young's modulus E shown in Fig. 14.3 (b), combined with a value of the wall thickness to diameter ratio of 0.01 (Fig. 14.4), can be substituted into Equation (14.3) to estimate the distensibility, and the wave-speed can again be predicted from Equation (14.6). The values of the wave-speed so obtained vary continuously from about 1 m s-1 at a transmural pressure of 0.5 x 10³ N m-2, to about 9 m s-1 at a transmural pressure of 104 N m-2.
These predictions indicate that the wave-speed in veins is less than that in large arteries, as long as the transmural pressure remains small (less than about 3 x l03 N m-2). However, when the transmural pressure is as large as 104 N m-2 (as in the foot of an upright man), the wave-speed in a vein may be as great as or greater than that in the corresponding artery, despite the fact that the pressure in the artery still exceeds that in the vein by about 104 N m-2. (This may be somewhat academic since, as we have seen, pulsations are not usually transmitted to the veins in the foot.)
The measurements of small high frequency sinusoidal waves were made in the abdominal venae cavae of dogs at values of transmural pressure between 0.5 x 10³ N m-2 and 2.5 x 10³ N m-2. The results for one dog, with different frequencies, are shown in Fig. 14.9, where it can be seen that the wave-speed varies from 2 m s-1 to 6 m s-1 over the applied pressure range. The results for different dogs showed a wide scatter, the wave-speed at a transmural pressure of 103 N m-2 varying from less than 1 m s-1 to nearly 3 m s-1. These values cover a similar range as the predicted values at the same transmural pressures, despite the fact that the applied frequencies were unphysiologically high (20 Hz or above). The measured wave-speed falls slightly as the frequency drops. No experiments were performed on vessels whose cross-section had become markedly non-circular, so no measurements are available to check the prediction that the wave-speed varies rapidly with transmural pressure when that is very low.
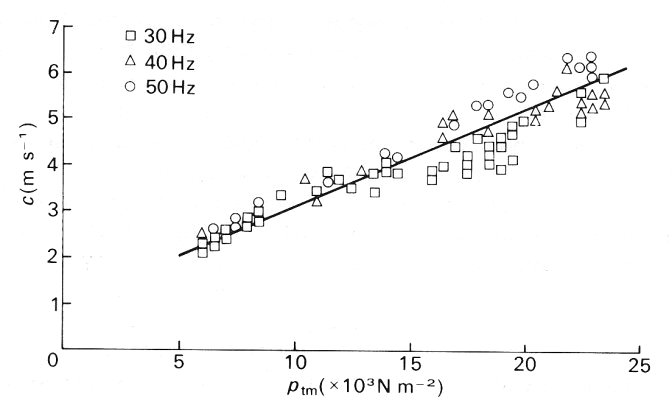
Fig. 14.9. Wave-speed c of imposed small-amplitude sinusoidal oscillations in the vena cava of a dog, plotted against transmural pressure ptm. The different symbols represent different frequencies of the waves. (After Aniiker, Wells, and Ogden (1969). 'The transmission characteristics of large and small pressure waves in the abdominal vena cava', p. 271, Trans. on Bio-med. Eng. BME-16, Institute of Electrical and Electronics Engineers Inc., New York.)
These experiments used short trains of high-frequency waves expressly to avoid distortions due to wave reflection. However, reflections are sure to arise in vivo at every site where the vessel properties change. Such sites will include junctions with other veins, valves, and regions where the transmural pressure and hence cross-sectional area and distensibility change, for example where a vein enters the thorax and may collapse. Little experimental work has been done to determine how the pulse is reflected and transmitted at any of these sites, and too little is known about the venous bed for us to make any detailed predictions. However, it is observed that the pressure is virtually steady in a medium-sized vein in the arm (Fig. 14.7); this is true even when the central venous pressure has transient fluctuations of up to 1.3 x 10³ N m-2 (100 mm Hg) superimposed on it by coughing. This indicates that almost all the wave is reflected before it reaches this site (as in arteries, viscous and visco-elastic effects could not cause such complete attenuation of the wave in the distance available; see §12.7). The complete reflection is probably associated with the valves, because in patients with incompetent valves (who may also have varicose veins, §14.5.3) transient pulses generated by raising intrathoracic and intra-abdominal pressure (as in a cough) can often be detected in peripheral veins.
We can speculate about some of the mechanisms involved in wave reflection at a venous valve. Model experiments have shown that if a valve is already closed when a pressure pulse arrives from the direction of the heart, then the valve cusps bulge backwards elastically, but a negligible amount of backflow through it occurs. Thus a little of the energy of the wave is transmitted, but most is reflected as it would be at a closed end (see §12.4.3). If the valve is open, and the flow forwards through it when the pulse arrives, the situation is more complicated. Initially the pressure gradient will be reversed, so the valve will start to close, presumably by the same mechanism as operates to close the aortic valve (see §11.5.2). The time during which the pressure gradient is reversed may or may not be long enough for the valve to close completely before the pressure gradient is once more directed towards the heart. Thus the details of what reflection takes place, and what the flow is like on either side of the valve, will depend on the time course of the pulse, and hence on frequency; this is unlike reflection at a junction (§12.4).
In the experiments to measure the wave-speed in veins, the amplitude of the sinusoidal pressure oscillations was less than 0.2 x 10³ N m-2; in most cases this was a small fraction of the mean transmural pressure, and the waves were observed to remain sinusoidal. The amplitude of the normal pulse may, however, be twice as great as this, and even higher in some abnormal conditions. Furthermore the mean value of transmural pressure will in some veins lie between ±0.5 x lO3 N m-2, where the veins are expected to be particularly distensible, and can change their cross-sectional area and shape by a large amount when the pressure changes by 0.4 x 10³ N m-2. At these levels the passage of the pulse will cause large changes in the vessel cross-section; at the same time, the peak blood velocity of about 0.25 m s-1 (Fig. 14.8) will be almost half the predicted wave-speed (0.6 m s-1 - see §14.3.2). For both these reasons non-linear effects may be important, as we have seen in the discussion of pressure waves in arteries (Chapter 12, §12.5).
The most striking effect of non-linearity will be a steepening of the front of the pressure wave. In certain circumstances this may develop into a sharp pressure jump, analogous to a shock wave, and be accompanied by a rapid longitudinal variation in vessel cross-section. Direct evidence of 'shocks' in the venous system comes from the observation of venous 'pistol shot' sounds, which may be heard in the femoral and jugular veins of patients with leakage of the tricuspid valve. The sounds originate with the contraction of the right ventricle, which in such patients causes considerable regurgitation of blood into the right atrium and the venae cavae, leading to a very large amplitude venous pulse (cf. the arterial pistol shot, described in §12.6). The steepening of the front of the waves in the veins has been investigated, again by introducing artificial high-frequency waves into a dog's vena cava, and measuring the wave at two stations 4 cm apart. The imposed amplitude was varied between 0.46 x 10³ and 1.3 x 10³ N m-2 (3.5-10 mm Hg); the imposed frequency was 7-5 Hz; the results are shown in Fig. 14.10. The non-sinusoidal nature of the waves is evident, as is the progressive steepening of the front as it proceeds down the tube, despite the fact that there is considerable damping, as witnessed by the smaller amplitude at the distal station. Another possible effect of non-linearity is that the different frequency components in the wave-forms of the pressure gradient, velocity profile, and flow-rate may no longer be independent and may interact to affect the mean quantities as well (see §8.6). This means that inferring the mean flow from the mean pressure gradient may be inappropriate. However, no experimental evidence is available on this question; in arteries it is probably unimportant.
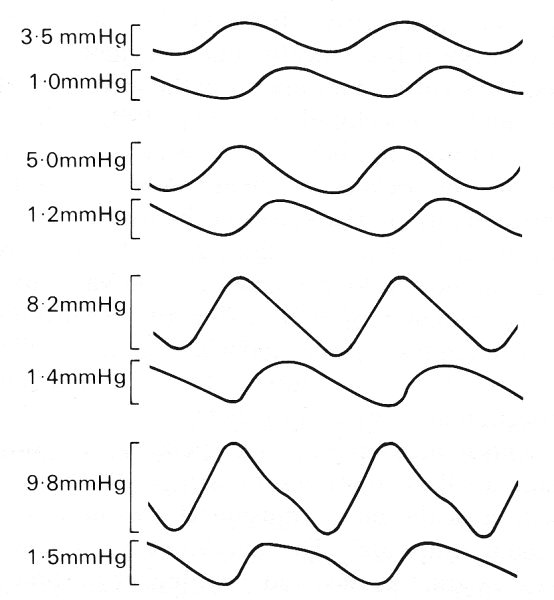
Fig. 14.10. Changes in shape of an imposed pressure wave of frequency 7-5 Hz as it travels along the abdominal vena cava of a dog. Each pair of traces illustrates a single amplitude of the imposed wave, and in each case the lower trace was recorded 4 cm distal to the upper, on an expanded scale. The amplitude of the wave in each case is shown beside the trace; note that the wave is increasingly distorted as its amplitude is increased. (After Aniiker, Wells, and Ogden (1969). "The transmission characteristics of large and small pressure waves in the abdominal vena cava', p. 268, Trans. on Bio-med. Eng. BME-16, Institute of Electrical and Electronics Engineers Inc., New York.)
Finally we turn to the attenuation of pressure waves in veins. As with every other property of the waves, this has been examined only with artificial high-frequency waves, and, as can be seen from Fig. 14.10, these are considerably attenuated. Measurements of the amplitude of small sinusoidal pressure waves at pairs of stations separated by different distances show that, as in arteries (§12.6.2), the amplitude falls off exponentially with distance. By analysing the waves at different frequencies it is found that the amount of attenuation per wavelength is independent of frequency, for frequencies greater than 20 Hz (see Fig. 14.11). That is, the amplitude a of the wave is equal to
a0 e-kx/l,
where x is a distance measured along the vessel, a0 is the amplitude at x = 0, l is the wavelength, and k is a constant. The value of k derived from the venae cavae of dogs was found to lie in the range 1.0 - 2.5 (attenuation of 63-92 per cent per wavelength), compared with the range 0.7-1.0 (50-63 per cent per wavelength), for the aorta (see Fig. 12.37, §12.6.3). Thus the rate of attenuation of high-frequency waves is greater in the vena cava than in the aorta. At a heart-rate of 2 Hz, a venous wave with a speed of 2 m s-1 would be attenuated by 20-30 per cent in a distance of 30 cm, the length of the dog's vena cava. This damping cannot all be due to the viscosity of blood because, as in arteries, the value of a is large in these experiments (see §12.3.3) and the energy lost in the viscous boundary layers is relatively small. The actual attenuation must therefore be predominantly due to the fact that the vessel walls have visco-elastic, rather than purely elastic, properties. Veins also exhibit significant visco-elastic behaviour at somewhat lower frequencies. For example hysteresis (§7.2) was found when the volume of a segment of vein was varied sinusoidally at a frequency of 5 Hz (the value of a still being large, about 14); the pressure was higher during inflation than at the same volume during deflation (Fig. 14.12).
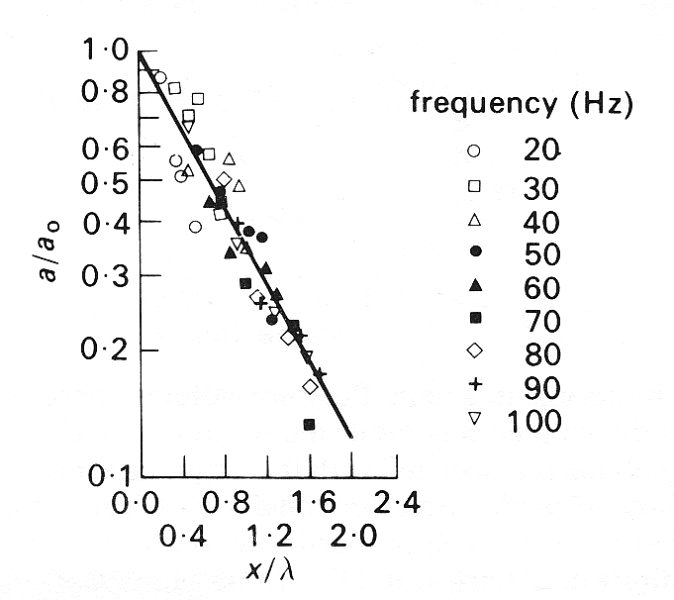
Fig. 14.11. The attenuation of small amplitude pressure waves in the vena cava of a dog. The ordinate is the ratio of wave amplitude a, to the amplitude a0 at a fixed site. The ordinate (x/l) is the distance distal to the fixed site (x) divided by the wavelength of the wave (l). The straight line in this semi-logarithmic plot is given by the equation a/a0 = e-kx/l with k = 1.05. The different symbols refer to different wave frequencies. The transmural pressure was in the range 1.0 to 1.5 x 10³ N m-2. (After Aniiker, Wells, and Ogden (1969). 'The transmission characteristics of large and small pressure waves in the abdominal vena cava', p. 271, Trans. on Bio-med. Eng. BME-16, Institute of Electrical and Electronics Engineers Inc., New York.)
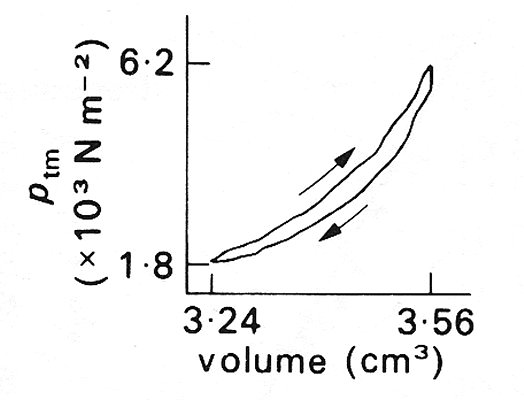
Fig. 14.12. Evidence of hysteresis in a vein. Pressure-volume curve of a segment of the inferior vena cava of a dog, while the volume was subjected to sinusoidal changes at a frequency of 5 Hz. The period of increasing volume is associated with the larger pressures, as indicated by the arrows. (The volume is plotted instead of the cross-sectional area because the length of the segment is unknown.) (After Attinger (1969). 'Wall properties of veins', p. 256, Trans. on Bio-med. Eng. BME-16, Institute of Electrical and Electronics Engineers Inc., New York.)
14.3.3 Flow patterns and velocity profiles in veins. The average velocity of blood in the inferior vena cava of a dog is between 10 cm s-1 and 20 cm s-l, and the diameter of the vessel is about 1 cm (see Table I) so the mean Reynolds number lies between about 250 and about 500; the peak Reynolds number is about 700. In smaller veins the Reynolds number will of course be smaller. The other important dimensionless number is Womersley's frequency parameter a (see §12.3.3); its highest value occurs in the vena cava, where at a heart rate of 2 Hz it is about 8. This too is smaller in smaller veins.
From a knowledge of these two parameters we can make predictions of the general characteristics of the flow in large veins, as long as their cross-section remains more or less circular, (i) We expect the flow to be laminar, because even the peak Reynolds number is far less than the critical value for steady flow of about 2300. (ii) There will be a long entrance length for the mean flow in the largest veins because the mean Reynolds number is quite large (assuming that the mean flow is independent of the oscillatory components, which may not be true - see §12.8.3). However, it will not be longer than the vessel, as it is in the aorta. In the inferior vena cava, the entrance length, as predicted by Equation (5.4), is 7.5-15 cm, although the presence of secondary motions in the flow entering a vein may cause these values to be decreased somewhat because the lateral mixing of slower and faster moving fluid is enhanced, so that the flow can develop more quickly. Thus even if there are thin boundary layers where the flow enters the vessel from subsidiary veins, the mean flow should be approximately fully developed before it reaches the heart, 30 cm from the entrance. (iii) Because the value of a is quite large, the oscillatory boundary layers on the vessel wall should remain thin (see §5.6), and the oscillatory flow in the core should have a flat velocity profile, in contrast with the curved profile of the fully developed mean flow. (iv) The entrance length for the unsteady flow should be short, about 4-5 cm, according to the formula given by Equation (12.33) in §12.8.2.
Apart from the effect of valves, which we know very little about, a major difference between venous and arterial flow is that venous flow is directed from the smaller vessels to the larger. Thus the pattern of flow at junctions will be different from that in arteries (§12.8.2). At a junction two streams come together, so that just beyond the flow divider the velocity profile in the plane of the junction will have a dip in the centre because the peak velocity in each tube upstream is off the axis of the parent tube. Each stream is forced to turn, so that secondary motions are set up (see §5.8), generating two pairs of secondary vortices. This has been verified by observing smoke patterns in a model bifurcation as shown in Fig. 14.13 (a). Measurements of the velocity profiles in the parent tube of the model, downstream of the flow divider, show that the boundary layers remain thin and that, except near the flow divider, the velocity profile is fairly flat (Fig. 14.13 (b)). Presumably this is because of the way the secondary motions redistribute the longitudinal flow. Unsteady flow in a junction of this nature has not been studied. We know of no systematic measurements of velocity profiles in even the largest veins, but secondary motions have been clearly seen in the inferior vena cava, downstream of the confluence of the iliac veins.
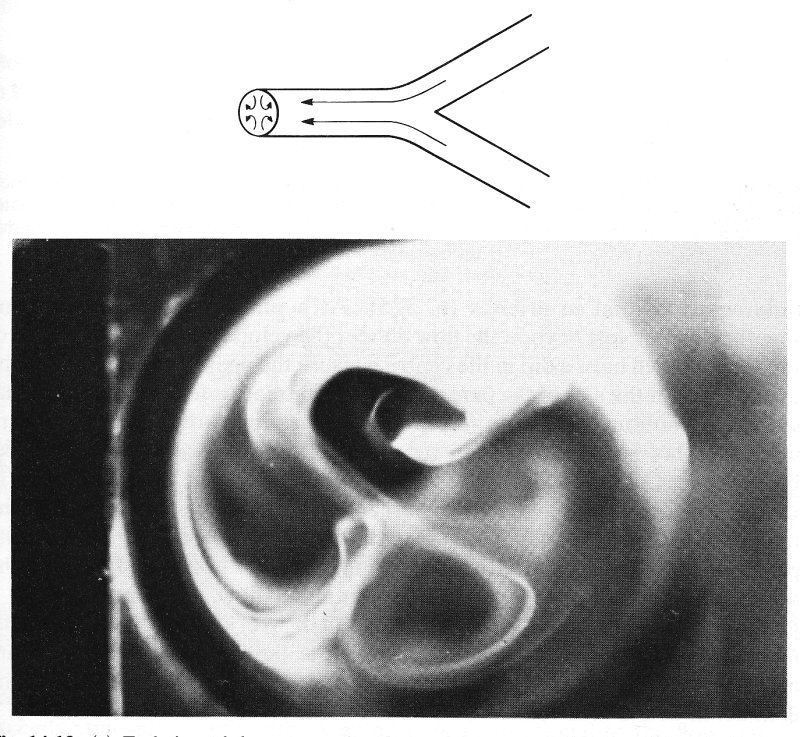
Fig. 14.13. (a) End view of the parent tube of a model symmetrical bifurcation when air flows steadily from the daughter tubes to the parent. Flow patterns visualized with smoke. Two pairs of secondary vortices can be seen. Parent tube Reynolds number = 700. (From Schroter and Sudlow (1969). 'Flow patterns in models of the human bronchial airways'. Respiration Physiology 7, pp. 341-55. North-Holland Publishing Co., Amsterdam.)
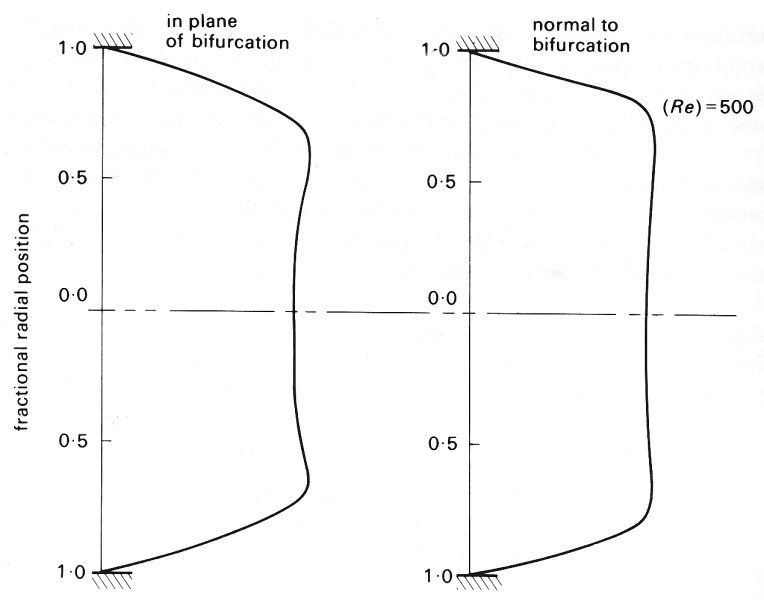
Fig. 14.13. (b) Velocity profiles in two planes in the parent tube of a model symmetrical bifurcating system consisting of 4 generations of the tube. Air flows steadily from the daughter tubes to the parent. Parent tube Reynolds number = 500. Note how flat the profile is and how thin the boundary layer is.
In circumstances when a vessel may collapse and its cross-section become markedly non-circular, a number of interesting phenomena can occur, and the relationship between pressure gradient and flow-rate becomes very complicated. For this reason a separate section is devoted to flow in collapsible tubes.
Curious behaviour of blood flow in a vein has been observed when the transmural pressure is very low. Reduction of the internal pressure at the downstream end is found to have little or no effect on the rate of flow, provided that it is less than the pressure outside the vessel. Moreover, the same result can be obtained with water flowing in a thin-walled rubber tube, in a model system. There has been quite extensive investigation of this phenomenon, most of the work being done with thin-walled latex tubes rather than blood vessels. Caution should be exercised in applying the results to actual vessels, because of the difference between the mechanical properties (§14.2) of the two types of tube. We shall first describe such a model experiment, and then suggest possible mechanical explanations for the results. Finally we shall indicate where in the circulation such phenomena might appear, and whether they are observed to do so.
14.4.1 Model experiments. The experimental arrangement is depicted schematically in Fig. 14.14. A segment of collapsible tubing is attached at its ends to two rigid tubes of the same diameter, and surrounded by a chamber whose pressure pc is controlled. Water flows through the tube and the static pressures at points just upstream and downstream of the collapsible segment are measured; they may be denoted by p1 and p2 respectively. Further downstream of the downstream pressure tap the water flows to atmosphere through a fixed resistance, so that p2 exceeds atmospheric pressure by an amount proportional to the flow-rate Q through the tube. This flow-rate can be varied by adjusting either the height of the upstream reservoir which supplies the water, or the value of an upstream resistance between the reservoir and the upstream pressure tap. It can also be varied by adjusting the downstream resistance; the consequences are then somewhat different, and are described later.
The results described first were obtained with the chamber pressure held fixed and the flow-rate reduced from a large value to a small one by an increase in the upstream resistance. The results are expressed as a graph of the pressure drop (p1 - p2) against flow-rate Q, and are plotted in Fig. 14.15 (a). The circled numbers on the curve refer to the photographs in Fig. 14.15 (b), which show a sequence of side views of the collapsible segment of the tube at successive stages in the experiment (flow is from right to left). Note that whenever there is flow, p1 must be greater than p2 in order to overcome any viscous resistance in the collapsible segment. The results fall into three distinct categories:
(i) When the flow-rate is sufficiently large for downstream pressure p2 to exceed chamber pressure pc, the pressure everywhere in the collapsible segment exceeds pc, and the tube remains almost circular (panels 1-6 of Fig. 14.15 (b).) The flow in the tube will everywhere be Poiseuille flow, so the pressure drop is proportional to flow-rate, with an almost constant resistance, as given by Poiseuille's law. Equation (5.1), §5.1. This is illustrated by the right-hand segment of the curve in Fig. 14.15 (a), marked I. The resistance is not exactly constant because, as the flow-rate is reduced, the diameter of the tube decreases slightly since the tube has a small distensibility (Fig. 14.2 (a)).
(ii) When the flow-rate is reduced below a certain critical value, the down-stream pressure becomes smaller than the chamber pressure. Thus for a very small further decrease in flow-rate, the transmural pressure at the downstream end of the collapsible segment becomes negative, and the cross-section begins to change shape and to collapse. The cross-sectional area falls rapidly as the transmural pressure falls, because of the large distensibility (Fig. 14.2 (a)). As the tube collapses in this way, the flow resistance rises rapidly, and the pressure drop required to maintain the (gradually falling) flow-rate also rises dramatically. This is illustrated by the central section (II) of Fig. 14.15 (a). The progressive collapse of the tube can be seen from panels 7-16 of Fig. 14.15 (b). At first (panels 7 and 8) the tube begins to taper towards its downstream end (where the internal pressure is least, close to p^), and partially collapses there. As the flow-rate is reduced further, the region of collapse extends further upstream (panels 9-16), until eventually the whole of the flexible segment is collapsed (panel 16). At this stage the upstream pressure, p1, has become approximately equal to the chamber pressure, pc. If, during this phase, the downstream resistance is changed so that p2 varies independently of p1, very little change in flow-rate is observed. However, if the chamber pressure is varied instead, the degree to which the tube is collapsed also varies, and the flow-rate changes accordingly. In fact, during such manoeuvres, the flow-rate Q is approximately proportional to p1 - pc, not p1 - p2.
(iii) Finally, when the whole segment is collapsed (upstream pressure less than chamber pressure), its cross section has the rather rigid dumb-bell configuration already described (§14.2). Thus as the flow-rate is reduced still further, no further change in cross section occurs (panels 17-20) and the resistance to flow once more becomes constant, the pressure drop falling in proportion to the flow-rate (region III in Fig. 14.15 (a)). The value of the resistance is 10-100 times higher than before collapse, however, because of the very narrow channels through which the fluid has to pass.
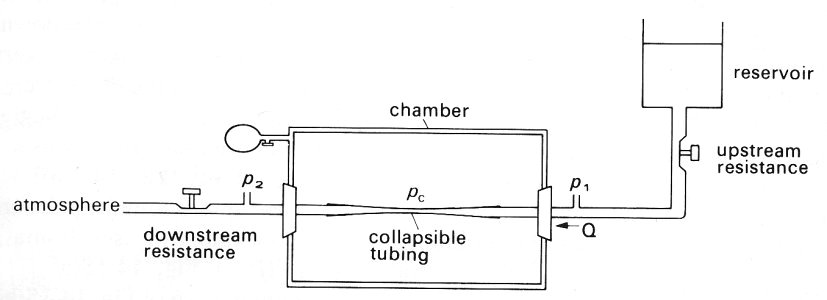
Fig. 14.14. Sketch of the experimental system for studying the flow of a liquid in a collapsible tube. The collapsible tube is attached to rigid tubes of the same diameter and enclosed in a chamber. Chamber pressure pc can be independently varied; tube pressures upstream and downstream of the collapsible segment (p1 and p2) can be measured. The flow-rate Q through the system can be altered by varying either the downstream resistance leading to atmosphere or the upstream resistance leading from the supply reservoir. Flow from right to left.
If at any stage the flow is stopped completely by closing the downstream resistance, the pressure everywhere in the tube will become uniform, taking a value determined by the level of the upstream reservoir. If this is such that pi is less than the chamber pressure the tube will remain collapsed, but if p1 is greater than the chamber pressure the tube will open again.
A qualitatively similar sequence of results to that outlined above is obtained whatever the Reynolds number of the flow through the tube. A further interesting phenomenon is observed in experiments in which the Reynolds number is quite large. This is that self-excited oscillations develop for a range of conditions in which the chamber pressure, the upstream reservoir and the downstream resistance are held fixed. A steady value of the flow-rate in such circumstances is thus expected, but when this value lies in region II (Fig. 14.15 (a)) oscillations in tube cross-section, pressure drop, and flow-rate are seen to develop spontaneously. (When such oscillations are present, mean values of flow-rate and pressure drop are plotted in Fig. 14.15 (a)). As the upstream resistance is increased, so that the mean flow-rate is reduced, the frequency of the oscillations increases. In the series of experiments from which Fig. 14.15 was taken the oscillation frequency was between 0.1 Hz and 1 Hz. What governs this frequency is not well understood; possible mechanisms causing the oscillations are discussed below.
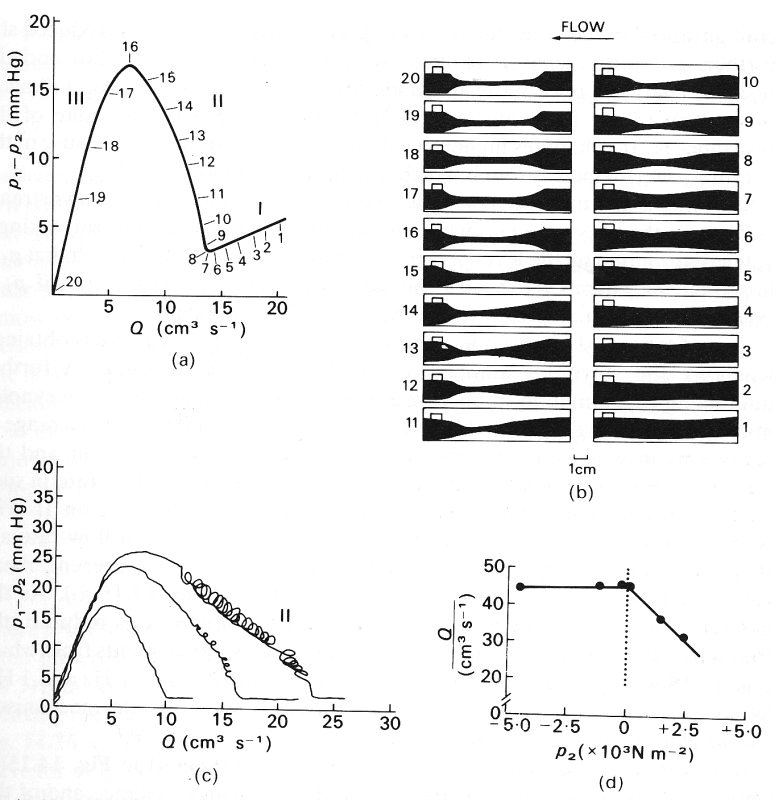
Fig. 14.15. (a) Graph of pressure drop (p1 - p2) against flow-rate, Q, in a model such as that shown in Fig. 14.14. Q was varied by varying the upstream resistance; the downstream resistance and the chamber pressure (pc = 3.3 x 10³ Nm-2) were kept fixed. The numbers in circles refer to the photographs in (b). The three flow regimes, I, II and III, are explained in the text.
(b) Side views of the collapsible segment of tubing at different stages of the experiment; numbers correspond to the numbered positions on the graph in (a). Flow from right to left.
(a and b from Conrad (1969). 'Pressure-flow relationships in collapsible tubes' pp 284-295 Trans. on Bio-med. Eng. BME-16, Institute of Electrical and Electronic Engineers Inc., New York.)
(c) Three curves, like that in (a), derived with three different values of the downstream resistance, the chamber pressure being kept fixed (= 3.9 x 10³ N m-2). Each trace is a continuous recording, made while the flow-rate was gradually increased, and the self-excited oscillations which occur in phase II of the experiment in some cases can be seen. Similar curves are obtained if the downstream resistance remains fixed and different values of the chamber pressure are taken, (c from Katz, Chen, and Moreno (1969). 'Flow through a collapsible tube', Biophys. J. 9, pp. 1261-79).
(d) Graph of flow-rate against downstream pressure pz, measured relative to chamber pressure pc. When p2 is less than pc the flow-rate is independent of p2. (d from Holt (1969) 'Flow through collapsible tubes and through in situ veins', pp. 274-83, Trans. on Bio-med. Eng. BME-16, Institute of Electrical and Electronic Engineers Inc., New York.)
It should again be emphasized that the results presented in Fig. 14.15 (a) were all obtained with fixed values of the downstream resistance and of the chamber pressure. A different curve is obtained if either of these quantities is changed; all such curves have a similar shape, and all come together in region I when the tube is fully open. However, if either the chamber pressure is reduced or the downstream resistance increased, the slope of the curve in regions II and III is reduced, as is the maximum pressure drop (Fig. 14.15 (c)). This makes it clear that the value of the pressure drop required to maintain a given mean flow-rate depends on the chamber pressure and the downstream resistance. If the upstream and downstream resistances are held fixed and the chamber pressure is increased from atmospheric, then both the flow-rate and the pressure drop p1- p2 remain unaltered until the chamber pressure exceeds the downstream pressure. Then the flow-rate starts to fall, in proportion to p1- pc, as stated above, until the tube is completely collapsed, when it remains at a more or less constant, small value. Similarly, if the downstream resistance is decreased, with chamber pressure fixed above atmospheric, and with the upstream resistance fixed, the downstream pressure will fall initially, and p1- p2 and hence the flow-rate will increase. However, when the downstream pressure becomes less than the chamber pressure collapse will begin, and the flow-rate will stop falling, ultimately taking a value determined by the value of p1- pc (Fig.l4.15 (d)).
14.4.2 Mechanisms. We can easily see why the resistance of the flexible tube increases as it collapses. The cross-sectional area decreases, so for a fixed flow-rate the average velocity increases, and the viscous shear-stress on the wall, which retards the fluid, correspondingly increases. The surface area over which this shear-stress is operating does not decrease because the perimeter remains almost constant. This increase is enhanced by the flattening of the cross-section, which requires high velocity gradients across the shortest diameter. The flow-rate can thus be maintained only by increasing the pressure drop. An indication of the amount by which the pressure drop has to rise can be obtained from the theory of fully developed viscous flow in a straight elliptical tube of major and minor axes la and 2b. The ratio between pressure gradient and flow-rate (the resistance) is in this case given by
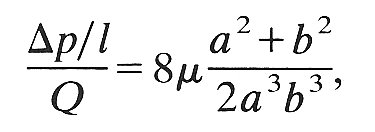 (14.7)
where r. is the viscosity of the fluid. The factor (a2+b2)/2a3b3 is equal to 1/a4 when the cross-section is circular (so that a = b), and in that case Equation (14.7) reduces to Poiseuille's law (Equation (5.1)). The effect on this quantity of reducing the area of the ellipse while keeping its perimeter constant is shown in Fig. 14.16 (a). The graph of resistance against area is compared with the same curve for a circular tube whose radius is decreased; the increasing ellipticity of the tube can be seen to contribute an increasingly large amount to the resistance as the area decreases. Note that the ratio of minor to major axis, b/a, falls to a value of 0.75 with only a 10 per cent change in resistance (Fig. 14.16 (b)).
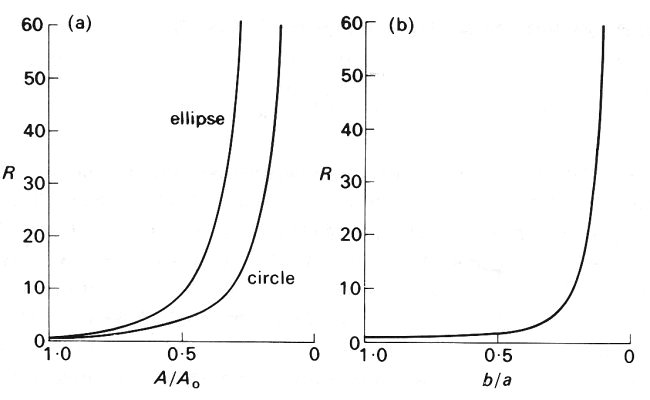
Fig. 14.16. The resistance of a straight elliptical tube of constant perimeter plotted (a) against cross-sectional area and (b) against the ratio of minor to major axis (b/a). The dimensionless parameter R is the resistance of the tube divided by the resistance when the tube was circular; A/A0 is the cross-sectional area of the tube divided by the area when the tube was circular. Thus for a circular tube, A/A0= 1, b/a = 1, and R = 1. In (a) the curve is compared with that for a circular tube having the same cross-sectional area (but not the same perimeter, of course.) The resistance of each tube becomes infinite as the area goes to zero, but the elliptical tube has more than double the resistance of the circular tube when the area has fallen below about 0.5 A0 (b/a below about 0.25).
These theoretical results are based on the assumption that the elliptic tube has parallel walls. When there is a localized constriction, other factors come into play, at least if the Reynolds number is large (about 100 or above), and the results may become inaccurate. In that case, the flow, accelerated through the constriction, may separate from the tube walls when the area begins to increase again, forming a jet-like flow downstream (see §5.7). Such separated flows are always associated with large energy losses and pressure drops, over and above the direct viscous losses already considered, and may in part be responsible for the rise in resistance observed in phase II of the experiment.
A complete theoretical analysis of the pressure-flow relations at the large Reynolds numbers present in most of the experiments (and appropriate for the study of large veins) is not available. A very approximate analysis can be performed by assuming that the flow does separate downstream of the constriction and that therefore no pressure recovery takes place (Fig. 14.17). Then the pressure at the constriction is equal to the downstream pressure p2, whereas the cross-sectional area (A2) there is much smaller than that at the upstream pressure tap (A1). Thus the average fluid velocity at the constriction (Q/A2) is much greater than that upstream (Q/A1). Neglecting the direct viscous pressure loss between the upstream pressure tap and the constriction, we can apply Bernoulli's equation (Equation (4.6), §4.7) to obtain
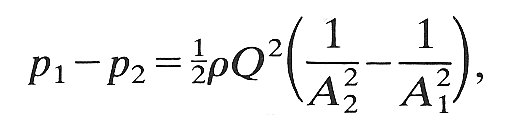 (14.8)
where r is the fluid density. All quantities except the area of the constriction, A2, are measured in the experiment; this can be estimated either from photographs like those of Fig. 14.15 (b), or by linking it to the known transmural pressure p2 - pc through independently measured distensibility relations (Fig. 14.1 or 14.2). Then Equation (14.8) can be tested experimentally. One such test has been performed, and shows reasonably good agreement with theory.
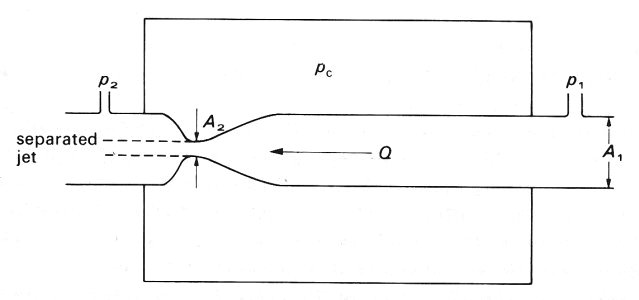
Fig. 14.17. Illustration of the separation of the flow from a constriction when the Reynolds number is large. The upstream, downstream and chamber pressures are p1, p2 and pc respectively; the volume flow-rate is Q; the upstream area is A1 and that at the constriction is A2.
The oscillations which develop are even more difficult to explain. One possible mechanism also uses Bernoulli's equation, and can be summarized as follows. Suppose that the pressure at the downstream end of the tube is slightly less than that in the chamber, so that the tube begins to collapse. As the constriction develops, the flow-rate does not at first fall because of the fluid's inertia. Thus the velocity in the constriction increases, and so, from Bernoulli's equation, the pressure falls. This fall increases the pressure difference between the chamber and the tube, and the collapse is therefore accelerated. When the cross-sectional area becomes very small, the resistance becomes very high, both through direct viscous action in the constriction and because of separation of the flow and turbulence downstream of it. Therefore the flow-rate falls, and the pressure just upstream of the constriction rises. This high pressure causes the collapsed section to reopen, after which the upstream pressure falls again and the cycle is repeated.
This explanation of the oscillations is very plausible, but cannot be entirely correct because it ignores the inertia associated with local acceleration and deceleration of the fluid every cycle. The observed frequency of the oscillations is such that a is large (between 4 and 13), and the inertia will not be negligible. No theory which incorporates it has yet been developed; when one is, it may involve the presence of 'shock' waves in the tube (§12.6). The energy dissipation associated with wall visco-elasticity is likely also to be important.
14.4.3 Physiological evidence: Korotkoff sounds. It has already been stated that veins collapse when the transmural pressure is negative, one example being the veins in the neck of an upright subject. However, there appear to be no experiments in which the relationships between transmural pressure, cross-sectional area, and flow-rate have been measured at the same time in a vein at or near a point of collapse, nor any observations of self-excited oscillations in veins. There is nonetheless a familiar situation in which high-frequency oscillations develop in systemic arteries, and they are probably similar to those described in the model experiments. These are Korotkoff sounds.
When arterial blood pressure is measured with a cuff inflated around a limb, the cuff pressure is usually raised to a level well above the peak (systolic)arterial value, so that the artery collapses and blood flow stops. Then, while the observer listens for sounds with a stethoscope over the artery downstream, the cuff pressure is gradually lowered. At a certain stage, Korotkoff sounds' are heard, in time with the heart beat. It has been shown by angiographic and ultrasonic techniques that the first appearance of the sounds coincides with the onset of blood flow through the collapsed artery segment. With progressive lowering of the cuff pressure, the duration of the Korotkoff sounds during each cardiac pulse lengthens, because the compressed segment is open for longer. However, as the cuff pressure approaches diastolic pressure in the artery, the sounds become muffled and then disappear. It is not certain whether it is the muffling or the disappearance of the sounds which coincides with the cuff pressure being at the diastolic level, but, by internationally agreed convention, it is the pressure at which muffling occurs that is taken as diastolic pressure. If the amplitudes of the different frequency components of the sounds are plotted, as in Fig. 14.18, it can be seen that prior to muffling there is a significant contribution to the sounds from components with frequencies up to 180 Hz. With the onset of muffling, however, there is a considerable reduction in all frequencies between 60 Hz and 180 Hz.
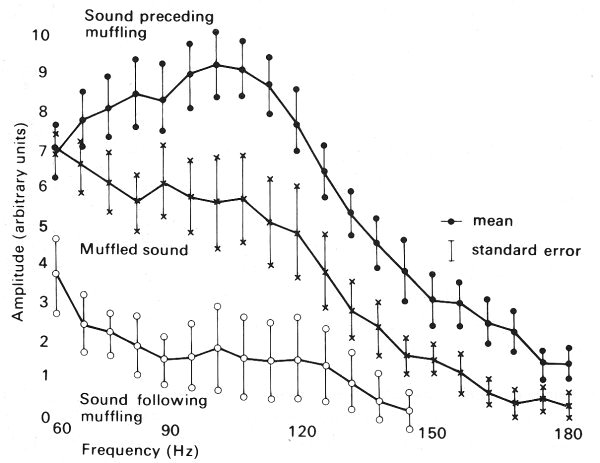
Fig. 14.18. Graphs of amplitude against frequency for different high frequency components of Korotkoff sounds. The upper trace was obtained at a cuff pressure between systolic and diastolic pressure; the middle trace was obtained when the sounds were muffled, with cuff pressure approximately equal to diastolic pressure; the lower trace was obtained at a cuff pressure below diastolic pressure. (After McCutcheon and Rushmer (1967). 'Korotkoff sounds: an experimental critique'. Circulation Res. 20, 154. By permission of the American Heart Association Inc.)
Observations on casts, made by injecting substances into the arteries of a limb at arterial pressure while the limb was compressed by a cuff, show that the cross-sections of the arteries in this situation are distinctly non-circular. Both the area and the circumference of the vessels were greatly reduced, recalling the behaviour of excised veins under compression, and longitudinal corrugations were observed on the inner surface. This suggests that systemic arteries, like veins, collapse when the transmural pressure is close to zero or negative. It is therefore plausible that Korotkoff sounds are a manifestation of the self-excited oscillations described above.
From our study of the properties of veins we turn now to an examination of complete venous beds, and the effect of external influences such as the contraction of skeletal muscle and respiration on the flow of blood through them. Because of the low transmural pressure and the consequent great distensibility of veins, the volume of the system is very sensitive to manoeuvres which change the transmural pressure. Also the non-linear mechanical properties of veins mean that the corresponding changes in flow-rate are difficult to predict. We can only describe qualitatively the expected response and indicate to what extent it is consistent with physiological observation.
14.5.1 Elevation of a venous bed above the level of the heart. When a venous bed (e.g. in the arm) is situated roughly at the level of the heart, the mean venous pressure is everywhere about 0.5 x 10³ N m-2, and none of the vessels is expected to be collapsed. As the arm is raised, the transmural pressure is reduced, and the veins collapse. For this to happen the volume of blood contained in them must be reduced. (This will be effected both by a transient surge in the outflow from the bed, and by a slight transient decrease in inflow because the cross-sectional area of the veins is reduced and hence the impedance of the venous system is increased; see §12.4.6 for a discussion of impedance. The former is likely to be much more important, because the impedance of the large veins and heart remains considerably less than that of the microcirculation.) The mean flow-rate through the venous bed will remain approximately constant because the mean flow-rate through the arteries will be effectively unaltered by the manoeuvre, since the input impedance of the arterial system, determined by the visco-elastic properties of the arteries and the resistance of the microcirculation, is itself virtually unaltered. The average blood velocity and shear-rate in the veins will both, therefore, be increased. The velocity and shear-rate will transiently be increased by a greater amount in the veins near the heart than in those further away, because the blood displaced by the vein walls while they are collapsing will augment the velocity most in the downstream segments.
14.5.2 Contraction of skeletal muscle. If there is mild, sustained contraction of the skeletal muscles in a limb at or below the level of the heart, the transmural pressure of the veins embedded in the muscle can be expected to be reduced, just as it is by elevation of the limb, and with similar effects on the venous bed. However, a sustained powerful contraction of the skeletal muscles in a limb can cause the blood flow in the muscles to cease, presumably by compressing and obstructing first the veins, and then perhaps the arteries.
Intermittent contraction of the skeletal muscle in a limb has a more complicated effected on the local venous circulation than a sustained mild contraction. The response depends on a number of factors, including the strength and frequency of the contraction, the volume of blood in the bed, the presence of the venous valves and the time required for the bed to refill after being emptied. The effects can be demonstrated dramatically in the leg veins of a normal subject by measuring the pressure relative to atmospheric pressure (approximately equal to the transmural pressure) when the leg is immobile, and when the subject contracts his leg muscles intermittently.
If the subject lies horizontally the mean pressure in an ankle vein is about 0.7 x 10³ N m-2 (5 mm Hg). If the subject is then tilted into the upright position and remains motionless the pressure gradually rises to a steady value of about 11.9 x 10³ N m-2 (85 mm Hg). The rise is gradual, because the venous valves prevent backfiow and the bed fills solely from the microcirculation.
If the subject then contracts his leg muscles repeatedly, as if walking (Fig. 14.19), the pressure in the vein rises during the first step, and then falls as the muscle relaxes. The pressure continues to fall with successive steps, and eventually comes to lie in the range 2-4 x 10³ N m-2. If the contractions cease, the pressure in the vein gradually rises to its previous level. Measurements of the total volume of the limb show that intermittent contractions of the muscle cause the volume of the limb to decrease because the venous blood volume is reduced. It follows that muscular contractions will be ineffective in lowering the local venous hydrostatic pressure (or blood volume) if the interval between contractions considerably exceeds the time needed for the bed to refill; the latter varies from about 50 s in a resting limb to about 5 s in a strongly exercising limb.
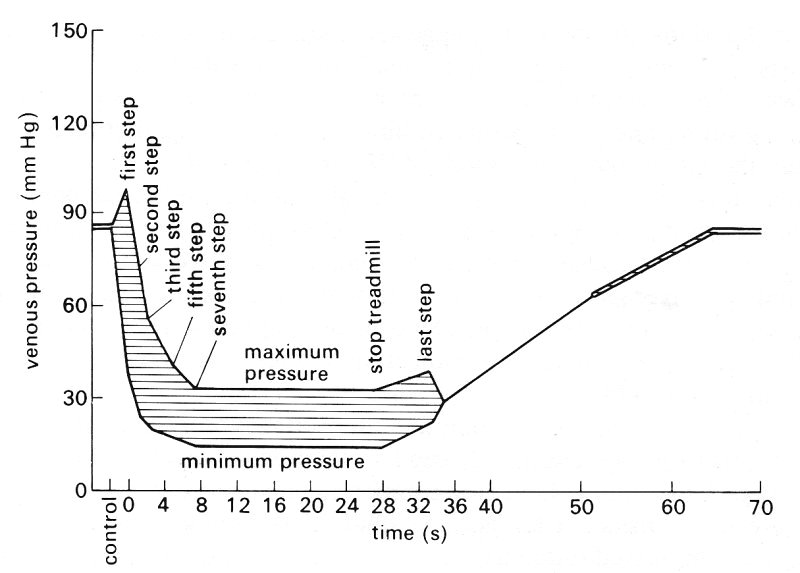
Fig. 14.19. Maximum and minimum pressures in an ankle vein of an erect subject. The subject is initially motionless, then walks, and finally again stands still. (From Pollack and Wood (1949). 'Venous pressure in the saphenous vein at the ankle in man during exercise and changes in posture', J. appl. Physiol. 1, 656.)
Contractions occurring too frequently for the bed to refill completely have other important effects on the mechanics of the local venous circulation. If the contractions are gentle there will be no significant active dilatation of small vessels in the muscles and therefore the peripheral resistance will be effectively constant. Since the rate of inflow of the blood into the bed is set by the arteriovenous pressure difference and the peripheral resistance, the lowering of the time-average venous pressure will increase the inflow and venous return from the bed in proportion to the extent by which that pressure difference is increased. In normal circumstances, however, venous pressure is so much less than arterial pressure that no significant increase of inflow results. It will be appreciated that though the excess pressure in the ankle vein of an erect immobile person is 12 x 103 N m-2, the excess pressure in the adjacent artery is about 24 x 103 N m-2 so that the arteriovenous pressure difference is still about 12 x 103 N m-2. What such gentle contractions do is to cause the blood flow in the veins to fluctuate and perhaps affect the distribution of the flow, because some veins may be compressed and others dilated. At certain frequencies of contraction outflow from the compressed veins to those downstream will occur only during the period of contraction, because the veins are refilling during the period of relaxation. However, since the time-average volume flow-rate of the bed is unchanged and the time-average venous blood volume is reduced, the average velocity of blood in the veins must be increased, and its mean residence time (volume of bed/volume flow-rate) decreased.
There are several implications of these results. Subjects who stand motionless for long periods will undoubtedly have higher hydrostatic pressure in their veins and more distension of these vessels than those who intermittently contract their leg muscles, as by walking. Subjects who have incompetent venous valves will not be able to reduce the transmural pressure or the diameter of their leg veins as effectively by muscle contraction as normal subjects; incompetence of venous valves is a common sequel to thrombosis within the veins. It has been suggested that sustained distension of veins predisposes them to becoming abnormally dilated (varicose).
It was mentioned previously (Chapter 10) that thrombosis is prone to occur in the leg veins of persons who are confined to bed. No explanation is available for this, though the incidence is reduced if, for example, they exercise their legs, or their legs are subjected to rhythmically applied external compression (without a change in time average volume flow-rate).* [*Experimental measurements have shown that intermittent external compression of a limb, applied for 5 s every minute at a rate of increase of pressure of 103 N m-2 s-1, had no effect on the time-average volume flow-rate, though it markedly reduced the incidence of deep vein thrombosis.] This suggests that the process may be associated with decreased pulsatility of venous blood flow, reduced time-average values for venous blood velocity and shear-rate, and an increased residence time of the blood in the leg veins. However, no causal relationship between these mechanical factors and the occurrence of thrombosis has been established.
It is important to appreciate that the intermittent contraction of the muscles in a limb will have a qualitatively similar effect on venous blood pressure and flow whether the venous valves are competent, incompetent or even absent. To illustrate this consider a horizontal liquid-filled flexible tube whose central portion is compressed suddenly. The instantaneous and time-average outflows from the two ends will be the same only if the impedances at the two ends are identical. Thus if there is a competent or partially competent valve upstream and only a very flexible chamber (such as the right atrium) downstream, most of the flow will be directed towards the chamber which has the lower impedance. In veins, the result will be similar even if the valves are totally incompetent or absent, because the impedance of the upstream vessels far exceeds that of the veins and right atrium downstream.
So far we have dealt with small segments of the venous bed, and have been justified in considering their behaviour in isolation because changes within them have an insignificant effect on the circulation overall. If, however, such changes affect a large part of the venous system they may significantly alter the venous return to the heart, and this, as discussed in Chapter 11, may affect cardiac output. This in turn affects the flow into the venous bed itself. Many respiratory manoeuvres fall into this category.
14.5.3 Respiratory manoeuvres. There is very little established information on the effect of respiratory manoeuvres on the venous system, and some disagreement still exists between different investigators. We therefore deal with the subject briefly, and almost exclusively confine ourselves to reporting experimental measurements made in the vena cava. It must be borne in mind that these manoeuvres can also have a strong influence on conditions in systemic arteries. by modifying both venous return to the heart and the mechanics of intrathoracic arteries. Through reflex action they may also affect the heart-rate and the peripheral vascular bed.
There has been interest for over two hundred years in the effect of breathing on the veins and venous return. The distinguished Swiss anatomist and physiologist Albrecht von Haller (1703-88) proposed that the enlargement of the thorax during inspiration, and the associated reduction of the intra-thoracic pressure, would cause blood to be drawn from the extra-thoracic veins into the intra-thoracic vessels and heart. Expiration would have the opposite effect, the increased thoracic pressure causing both a reduction in the volume of intra-thoracic veins, and an increase in their pressure, so that the flow-rate into them from the unchanged extra-thoracic veins would be reduced. This is what happens during quiet breathing, but other respiratory manoeuvres may have more complicated consequences.
The events accompanying a deep sustained inspiration against a closed glottis (a Mueller manoeuvre) are shown in Fig. 14.20. The alveolar and intrapleural pressures are reduced, and therefore so too are the pressures in the right atrium and the thoracic vena cava. The abdominal pressure, however, rises steeply, because of the contraction of the abdominal muscles and the lowering of the diaphragm, and this rise is transmitted to the abdominal segment of the inferior vena cava. Thus there is a greatly enhanced pressure difference between the abdominal and thoracic segments of the vena cava, so the blood in the abdominal vena cava is sharply accelerated. There is only a transient increase in blood velocity, however, and subsequently it remains only slightly elevated. This is because the pressure in the abdominal cavity exceeds that in the abdominal vena cava at its downstream end (i.e. just below the diaphragm) so that the vessel collapses there. The mechanisms described in §14.4 are then operative (although no self-excited oscillations have been observed), and the flow through the abdominal vena cava is independent of the pressure in the right atrium, as long as that remains below the pressure in the abdominal cavity. The record of blood velocity in the abdominal vena cava shown in Fig. 14.20 reveals that the timing (or phase) of cardiac oscillations is different from normal, with peak velocity (towards the heart) occurring during atrial systole rather than ventricular systole. This is a further illustration of the fact that right atrial pressure has no effect on flow in the abdominal vena cava; the origin of the oscillations in this case is not clear. At a later stage in the manoeuvre, the pressure in the atrium can be seen to rise, that in the abdominal vena cava to fall and the blood velocity to increase, and eventually the normal cardiac pulsations are restored. This was presumably because the subject was unable to maintain the high pressure in the abdominal cavity, or the low pressure in the thorax, so that the vein did not remain collapsed.
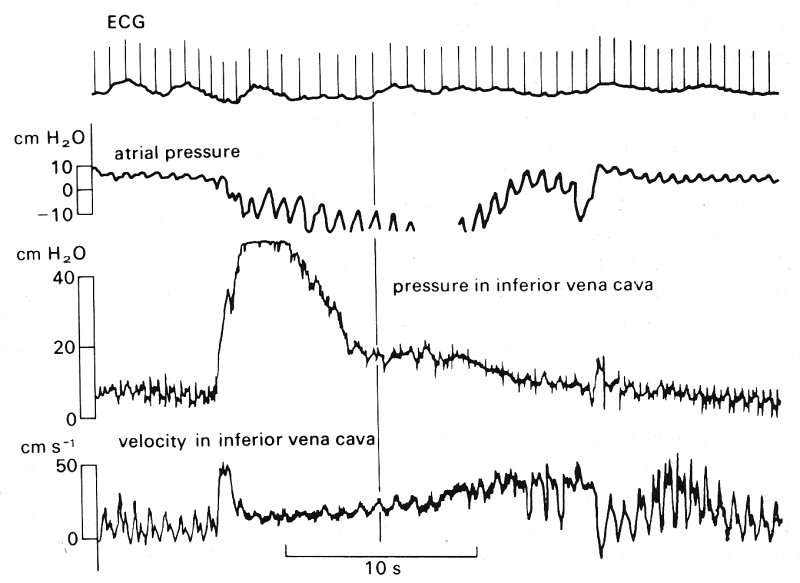
Fig. 14.20. Changes in right atrial pressure and in inferior vena caval (IVC) pressure and velocity during a Mueller manoeuvre. Top trace is the ECG. The probes measuring IVC pressure and velocity were situated below the diaphragm, in the abdominal vena cava. The vertical line is drawn to show that, during the manoeuvre, peak velocity occurred at the same time as peak atrial pressure. (From Wexler, Bergel, Gabe, Makin, and Mills (1969). 'Velocity of blood flow in normal human vanae cavae', Circulation Res. 23, 356. By permission of the American Heart Association Inc.)
Little is known about the variations of intra-abdominal pressure during breathing in general. In quiet breathing the abdominal muscles are believed to relax before, or simultaneously with, the descent of the diaphragm in inspiration, so that intra-abdominal pressure remains constant or falls slightly during inspiration. In deep breathing it is believed that the abdominal muscles remain partially contracted, so that descent of the diaphragm during inspiration causes intra-abdominal pressure to rise as in the Mueller manoeuvre. As a result blood velocity falls in the veins upstream of those in the abdominal cavity, for example the femoral veins, and blood in the intra-abdominal veins is expelled centrally towards the thoracic cavity.* [*In patients with certain diseases, such as constrictive pericarditis or conditions when there is excess fluid within the pericardial cavity, the heart is prevented from expanding freely. When such a patient inspires deeply, central venous (i.e. right atrial) pressure rises and the neck veins become distended. Normally, an elevation of right atrial pressure produces an increase in the output of the right ventricle which can compensate for the increased flow into the thorax, but in such subjects this may be impossible. The clinical name for this phenomenon is 'Kussmaul's sign'.]
Valsalva's manoeuvre, in which a subject makes a forced expiration against a closed glottis and thus raises both intra-thoracic and abdominal pressure, also influences venous mechanics. During this manoeuvre venous blood flow falls to zero where the large veins enter the thoracic and abdominal cavities; it is not restored until the inflow of blood from the microcirculation into these veins has raised their pressure above that of the veins in the thoracic and abdominal cavities. The Valsalva manoeuvre thus leads to a great reduction in venous return to the right atrium, and thus of output from the right side of the heart. This in turn leads ultimately to a reduction in output from the left side of the heart. However, left ventricular output does not fall to zero since the manoeuvre does not affect the circulation through the vessels in the thorax and abdomen. Sufficient cerebral circulation is usually maintained to keep the subject conscious, by reflex peripheral vasoconstriction, although there is a fall in systemic arterial pressure.