
In discussing the mechanics of blood flow in large arteries, it is both convenient and physically sensible to regard the given input of the system as the pressure pulse at the root of the aorta (Fig. 12.18). The excess pressure (pea) here fluctuates about an average value of approximately l.3 x 104 N m-2 (100 mm Hg). This is much greater than the corresponding excess pressure (pev) in the vena cava (which is close to zero), and it is this arterio-venous pressure difference (pea - pev) which causes the blood to flow. If the vascular system consisted of a single long, straight, rigid tube, with Poiseuille flow in it, the volume flow-rate (Q) would at all times be uniform (i.e. the same at all stations along the tube) and directly proportional to the pressure difference between the two ends. That is,
pea - pev = RQ (12.2)
where R is a constant resistance, and Q, pea, pev all vary with time (cf. Equation (5.1), §5.1). The same would be approximately true in a more complicated network of tubes, as long as they were rigid and the Reynolds number small enough for entrance effects to be small and secondary flows weak (cf. §5.3). In any rigid system the pressure wave-form at any point in the circulation would be similar to and synchronous with that at the root of the aorta, but with an amplitude scaled down by a fixed proportion according to the position of the point. In fact, for the values of Reynolds number occurring in arteries, this would not be a good approximation because of the long entrance region (see Equation (5.4), §5.3). However, if the system were rigid, the gross pressure changes would be almost synchronous everywhere, and the volume flow-rate into the system would always be equal to the volume flow-rate out.
12.3.1 The Windkessel model. Now, in vivo the time-course of the pressure pulse is not similar or synchronous everywhere (Fig. 12.14), the time-course of the volume flow-rate (or average velocity) is not the same in the vena cava as in the aorta, and at neither location is it proportional to the applied pressure difference. The reason for these observations lies in the elasticity of blood vessels. When blood is pumped from the heart, and the pressure rises in the large arteries, they expand. When the pressure subsequently falls, they contract again, so that the flow-rate through the small peripheral vessels does not immediately fall to zero. This action of the arteries in storing blood during systole and ejecting it in diastole was first described by Stephen Hales (a country parson, who was also the first person to measure blood pressure) in 1733, but it was not until 1899 that the German physiologist Otto Frank proposed a theory based on this idea.
In Frank's model (Fig. 12.22)
Fig. 12.22. The Windkessel model of the arteries, consisting of a compliant chamber of volume V, proportional to the excess pressure pea within it. The flow rate Q out of it is proportional to the pressure difference (pea - pev) between arteries and veins, the constant of proportionality being the resistance of the microcirculation. The flow rate into the system from the heart, QH may be different from Q.
the arteries are represented by a compliant chamber (usually called a 'Windkessel', or air chamber), whose volume V is proportional to the excess pressure within it. The microcirculation is represented in this model by a single constant resistance, with the flow-rate Q directly proportional to the pressure difference across it. Equation (12.2) therefore represents the relation between the flow-rate through the microcirculation and the arterio-venous pressure difference, and if the excess pressure in the veins is taken to be much smaller than that in the arteries, it may be set to zero without greatly altering the predictions of the model:
pea = RQ (12.3)
The volume of the arterial chamber is related to the pressure within it by
pea = V/C (12.4)
where C is a constant compliance or capacitance; this is a gross oversimplification, even for a single artery, as the discussion in Chapter 7 well shows. Finally, the rate of increase of volume of the chamber, dV/dt, must be equal to the difference between the rate of flow into it from the heart QH, and that out of it into the microcirculation, Q:
 (12.5)
The three Equations (12.3), (12.4), and (12.5) can be combined to form a single equation giving pea, V, or Q, and this can be solved to relate the pressure in the arteries to the flow-rate into them from the heart at any time.
During diastole, when QH is effectively zero, this model predicts that the pressure in the arteries falls off exponentially with time, i.e.
![]() (12.6)
(12.6)
and such a decay is closely realized in practice. However, in early systole, when the inflow QH is large, the theory predicts that the rate of pressure rise is proportional to the inflow, while experiments show that it is the pressure itself (relative to end-diastolic pressure ped) which is proportional to the flow-rate, i.e.
pea - ped ~ QH
This defect demonstrates that the Windkessel model is inadequate to describe dynamic events accurately, even in the central circulation. Its conceptual simplicity is attractive, but it masks the crucial fact that the pressure pulse travels through the circulation as a wave.
12.3.2 The propagation of the pressure wave. The principal shortcoming of the Windkessel model lies in the assumption that all arteries are distended simultaneously. As we have seen (Fig. 12.14), the pressure peak occurs later in more peripheral arteries than in the aorta, and the pulse is propagated along the blood vessels in the form of a wave. As blood is pumped into the entrance of the aorta, the pressure there rises, the vessel wall is stretched and the tension in it also increases. As the rate of cardiac ejection slows down, the pressure begins to fall, and the distended wall returns towards its equilibrium position. The inertia of the fluid keeps it moving forwards after the driving pressure difference has fallen; this causes the first piece of artery wall to overshoot its equilibrium position, and an oscillatory motion is set up. At the same time the next section of wall becomes distended. As this too recoils, the fluid driven out distends a further section of the wall, which also recoils, and so on. Thus the disturbance is propagated along the arterial system in the form of a pressure wave; it is analogous to a wave propagating along a stretched string, described in Chapter 8 (§8.2). There is a balance between the restoring force, supplied by the elasticity of the artery walls, and inertia, supplied principally by the blood, although the inertia of the vessel wall itself makes a small contribution. As with the waves of Chapter 8, the pressure wave in an artery can propagate in either direction; however, in systemic arteries it primarily originates at the heart and travels distally, although as we shall see it is modified by components reflected from the periphery.
The radial wall motions associated with the pressure wave also cause some longitudinal motions of the vessel wall as it is stretched or compressed, but these are secondary, and have negligible influence on the propagation of the wave. One can also imagine a different kind of wave altogether, in which the oscillatory wall motions are primarily longitudinal, and drive longitudinal fluid motions in the boundary layer by viscous action, thereby providing inertia. There is little physiological evidence for the existence of these waves, and they are believed to have no significant influence on the measured pressures and velocities. They are discussed more fully in §12.7.
12.3.3 Determination of the wave-speed. We saw in Chapter 8 that the speed of propagation c of waves in a stretched string is governed by the balance between the restoring force (the tension in the string F) and the inertia (the mass per unit length M), and that the wave-speed is actually given by
 (12.7)
Thus, a heavier string has a smaller wave-speed than a lighter one at the same tension, and the wave-speed increases if the restoring force is increased by stretching it more tightly. A similar balance governs the speed at which pressure waves are propagated along blood vessels. The inertia is supplied by the mass of the blood (and of the vessel walls), and it can be characterized by the blood density p. The restoring force comes from the elasticity of the walls; if they are very distensible, the wave-speed will be low, whereas if they are stiff it will be high. We saw in Chapter 7 that the most direct measure of the stiff ness of a vessel wall is the quantity denned there as the distensibility D. This measures the fractional change in cross-sectional area (DA/A) of a segment of artery of fixed length when a small change in pressure (Dpe) is applied, so that D is given by
The arguments based on dimensional analysis, which led to Equation (12.7) (Chapter 8, §8.2) can be used here to show that the speed of propagation of pressure waves in blood vessels is proportional to (rD)-1/2. Indeed, it can be shown by a detailed mathematical analysis of a simplified model of an artery that, as in Equation (12.7), the constant of proportionality is equal to 1, so that
c = (rD)-l/2 (12.9)
As D is diminished c increases, and vice versa; that is, stiffer vessels transmit waves more rapidly, as we would expect.
The mathematical analysis which leads to Equation (12.9) is based on the two fundamental principles of fluid flow, conservation of mass and Newton's second law (force = mass x acceleration). These are applied to the motion of a fluid in an infinitely long distensible tube whose diameter does not change unless disturbances like the pressure pulse are imposed. This is already an over-simplified model of an artery, but two further approximations have to be made to obtain Equation (12.9). These are (i) that blood viscosity has no effect on the motion, and (ii) that the disturbance or pressure pulse is sufficiently small for the elastic wall properties and the fluid mechanics to be linear. The validity of these approximations must be examined.
Neglect of viscosity. By definition, viscosity is important only in regions where the fluid is being sheared, and the greatest shear-rate always occurs in the boundary layer close to the vessel wall, since the fluid velocity is zero at the wall itself. For oscillatory flow in a rigid tube, the thickness of the boundary layer is the distance over which viscosity can affect the flow in a time equal to one period of the oscillation, and is therefore proportional to (n/w)1/2, where n is the kinematic viscosity of the fluid and w the angular velocity of the oscillation. The parameter which governs how much of the tube is occupied by the boundary layer is therefore the ratio of the radius d/2 of the tube to (n/w)1/2, i.e. it is the Womersley parameter
which has already been defined in Chapter 5. Another way of looking at a is to notice that a 2 is the ratio between the time required for viscous forces to diffuse across the whole width of the tube (d2/4n) and a time characterizing the period of the oscillation (1/w). The same parameter is relevant in an elastic tube.
When a is large, the boundary layer is thin, and the volume of fluid retarded because of the no-slip condition on the tube wall is small compared with the volume set in motion by the passage of the wave. In the large arteries of all but the smallest mammals the value of a calculated from the frequency of the fundamental heart-rate is considerably larger than 1; for example, a typical value in the aorta of man is 20, in a dog it is 14, in a cat 8, in a rat 3. Representative values at other sites in a normal dog are shown in Table I; the corresponding values in man are about 50 per cent greater. Thus the neglect of viscosity is likely to lead to only a small error in the calculation of the propagation speed of pressure waves in large arteries. How big the error actually is, and what other effects viscosity might have, are investigated in §12.6.
The assumption of linearity. Linearity implies that a single-frequency oscillation in pressure is associated with only a single-frequency oscillation in fluid velocity, as discussed in Chapter 8 (§8.5). There are two potential sources of non-linearity which might be important in the propagation of the pulse wave. They both arise from the fact that pressure fluctuations are associated with changes in cross-sectional area of the vessel. Such area changes mean that the fluid velocity varies along the tube, and therefore there are convective accelerations (§4.5), as well as local accelerations, which have to balance the pressure gradient. It is these convective accelerations which are non-linear, because they involve the square of the velocity rather than the velocity itself, as discussed in relation to Bernoulli's Equation (4.6) in §8.5. This is one source of non-linearity, and it is unimportant if the convective acceleration is small compared with the local acceleration. This requires that the time scale for significant local changes in the fluid velocity, i.e. the wave-period 2p/w, should be small compared with the time taken for a fluid element to be convected to a position where the fluid velocity is significantly different. This second time-scale is equal to the wavelength, 2pc/w, divided by a representative fluid velocity u. Thus local accelerations always dominate as long as l/w is always small compared with c/wu, i.e. if
 (12.10)
This is approximately satisfied in large arteries, as we show later.
The second source of non-linearity lies in the fact that the vessel becomes stiffer as it is stretched (see Fig. 7.5 (a), §7.2). The theory leading to Equation (12.9) is linear, and hence applicable, only if the distensibility D is approximately constant throughout the motion; however, D decreases as the distending pressure is increased; therefore the pulse pressure should be small compared with the mean pressure for linearity to hold.
In fact, this ratio is normally about 0.2 in a systemic artery, so the question arises as to how much smaller than 1 it must be for the system to be approximately linear. Similarly the maximum value of u/c is normally about 0.25, and the same question arises. We shall see later (§12.5.) that the non-linearities of the system have a measurable effect; they are not important for predictions of wave-speed, although they do influence the shape of the pressure and flow wave-forms.
12.3.4 Comparison of theory with experiment. The distensibility D is relatively easy to measure in a segment of artery, especially under static conditions in which increments of distending pressure are applied and the resulting area changes measured step by step. Then, since the density of blood is known, it is possible to predict the wave-speed from Equation (12.9).
At first sight it seems a straightforward matter also to measure the speed of propagation of the pressure wave. One would record the pressure pulse at two locations in a blood vessel, a known distance apart, and measure the time taken for a given part of the wave (for example, the pressure maximum, or the 'foot' of the wave where the pressure first starts to rise) to travel between them. If the wave-form did not change shape as it propagated, that would indeed give an unambiguous measure of wave-speed. However, the wave-form does change shape. As we shall see in subsequent sections, the change in shape is associated with wave reflections from terminations and branches of the vessels, and with the continuous tapering of individual vessels. Another influence is the fact that different components of the wave have different frequencies* [* Examined by Fourier analysis - see §12.2.5 and §8.6.] and so may travel at different speeds and be attenuated by different amounts in a given length of tube. The presence of reflections, in particular, means that the apparent wave-speed as measured in an artery may not correspond closely to the intrinsic wave-speed with which waves would travel in an infinite tube with the same elastic properties. In that case it should not be possible to compare the prediction of Equation (12.9) with experiment. In fact it turns out that if the initial rising part of the wave is used for measurements of wave-speed, then everywhere except very near a site of reflection (see §12.4.1.) there is not enough time for reflected waves to return and distort the wave. We can therefore use this 'foot-to-foot' wave-speed as a measure of the intrinsic wave-speed in an artery. However, we must remember that there may be significant variations in the elastic properties of an artery along the segment between the two measuring sites, for example if there are branches, so that the wave speed may vary; thus only an average wave-speed for that segment can be measured.
Many workers do not use Equation (12.9) as it stands to predict the wave-speed, but instead rewrite it by means of the effective incremental Young's modulus E of the artery wall (see §7.2.). This means interpreting the distensibility in terms of a simple model in which the wall is assumed to behave like a thin, homogeneous membrane. Then D is given by Equation (7.3b), §7.2, to be
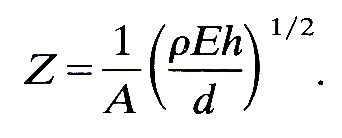
where h/d is the wall thickness to diameter ratio. When this is substituted into Equation (12.9), the predicted value of the wave-speed is seen to be
c0 = (Eh/rd)1/2 (12.11)
where c0 is merely the label we choose to give to this calculated value of wave-speed. This equation is very well known and is called the Moens-Korteweg equation, after two Dutch scientists who published the result in 1878. Actually it was first derived by Thomas Young in 1809. Equation (12.11) is likely to give less accurate results in practice than Equation (12.9) used directly, because of the interpolation of the simple model of wall elasticity. This can lead to error if used with values of E derived in different ways, largely because of the uncertainty in measurements of h/d. As long as these quantities are derived from distensibility measurements, however, use of Equation (12.11) is justified.
The values of c0 predicted from Equation (12.11) are given in Table I for comparison with the measured values of c. The most striking aspect of the comparison, considering the assumptions about viscosity, linearity, elasticity, etc., which have gone into the theory, is that in arteries the measured value of c differs from c0 by no more than 15 per cent, which is well within normal experimental error and physiological variability. This suggests that the simplifications introduced into the theory are not sources of great inaccuracy in the calculation of wave-speed.
Accuracy of the linearity approximation. Using the measured values of the wave-speed c and the peak blood velocity umax, given in Table I, we can check how well the assumption that u/c is always small compared with 1 is satisfied in practice. In the aorta and main pulmonary artery the maximum value of u/c is normally between 0.2 and 0.25, which is considerably less than 1 but not completely negligible. In more peripheral arteries, however, two factors combine to make u/c smaller: (a) the blood velocity falls, and (b) the wave-speed increases, because vessels become stiffer towards the periphery (see Table I.). Thus in normal dogs (and man) the assumption of linearity in analysing the propagation of the pulse wave is a good one in all but the largest arteries. This is confirmed by a simple calculation of the ratio of the pressure amplitude Dpe and the average excess pressure pe. In large arteries this ratio has a value ranging from about 0.2 in the ascending aorta to about 0.4 in the femoral artery (the 'peaking' of the pressure pulse), but it falls in small vessels.
There are pathological conditions in which the ratio u/c can take values very close to 1 in large arteries. These include rare connective tissue disorders, a feature of which is a very floppy arterial wall, so that c is low, and conditions in which the stroke volume is increased, like heart-block, aortic valve incompetence, and large arterial shunts such as patent ductus arteriosus. In all of these conditions the upstroke of the pulse-wave becomes very steep, and blood velocities greatly in excess of normal are recorded.
12.3.5 Further limitations of the simple elastic model. According to the theory outlined above the pressure wave will be propagated along the artery without change of shape. However, we can see from Figs. 12.14 and 12.19 that in the circulation the pressure wave does change shape as it propagates through the system. Furthermore the shape of the flow pulse (the graph of u against t) is predicted by the simple theory to be the same as that of the pressure pulse, with an amplitude equal to that of the pressure pulse divided by rc.* [*This is because, according to the equation of motion, the density times the local acceleration, r du/dt, must be equal to the gradient of excess pressure, -dp/dx. Both u and pe can be represented as the sum of a constant and oscillatory terms like
B cos{w(t - x/c) - q} (12.12)
where B is the amplitude, equal to a velocity scale u0 or a pressure scale p0 according to the quantity concerned. To derive acceleration and pressure gradient from velocity and pressure, we differentiate each such term, and obtain
r du/dt = - wu0 r sin{w(t - x/c) - q}
and
- dp0/dt = - wp0/c sin{w(t - x/c) - q}
For these two to be equal. u0 must equal p0/rc. If the wave were being propagated in the opposite direction, the sign of x/c in Equation (12.12) would be reversed, and u0 would equal -p0/rc.]
In fact, the shape of the flow pulse is completely different (Fig. 12.18), and its amplitude falls with distance from the heart, while that of the pressure pulse initially rises. (Fig. 12.19). This means that although the above theory yields a good prediction of wave-speed, and although linearity can reasonably be assumed, some of the other approximations in the simple model are quite inadequate. We must consider four factors which in real life modify the predictions of the simple model.(i) The tube has been assumed to be of infinite length, while in fact blood vessels are relatively short, so that wave reflections will occur at the ends. Indeed, the wavelength of the fundamental wave in the aorta (wave-speed = 5 m s-1, frequency = 1.2 s-1) is about 4 m, while the length of the aorta itself is about 0.5 m in man. Hence only a small fraction of the total wave can exist in the aorta at any given time; it was this fact which enabled Otto Frank, who was well aware of the facts of wave propagation, to justify his Windkessel model. The significance of wave reflections will be examined in the next section.
(ii) No artery is uniform along its length. The aorta in particular is both narrower and stiffer at its distal end than it is near the heart (see Table I), and it is this tapering which proves to be partly responsible for the peaking of the pressure pulse, seen, for example, in Fig. 12.19. The effect of the gradual tapering and stiffening of arteries with distance from the heart will be discussed in the next section.
(iii) Non-linear behaviour has already been mentioned. The situations in which it assumes importance are discussed in §12.5.
(iv) Finally, no mention has yet been made of the viscous dissipation of energy which accompanies any motion of a viscous fluid or a visco-elastic solid. This will lead to damping or attenuation of the wave, as explained in §8.3; it is discussed with reference to the pulse wave in §12.6.2.
Every point where the properties of an artery change will be a site of partial reflection of the pressure wave, in the same way that any discontinuity in a stretched string is a source of reflections (see §8.4). Throughout any artery there are many unevennesses and slight bends which will cause some reflection, but the most obvious and potent discontinuities are the junctions between arteries (Fig. 12.1). It is reflections which cause the greatest modification of the shape of the pulse wave as it travels peripherally. Therefore we must examine them in detail, first looking at a single junction in isolation, and then studying wave reflection at a sequence of discontinuities.
12.4.1 Reflection at a single junction. We begin by examining a single parent artery which branches into two daughters (Fig. 12.23).
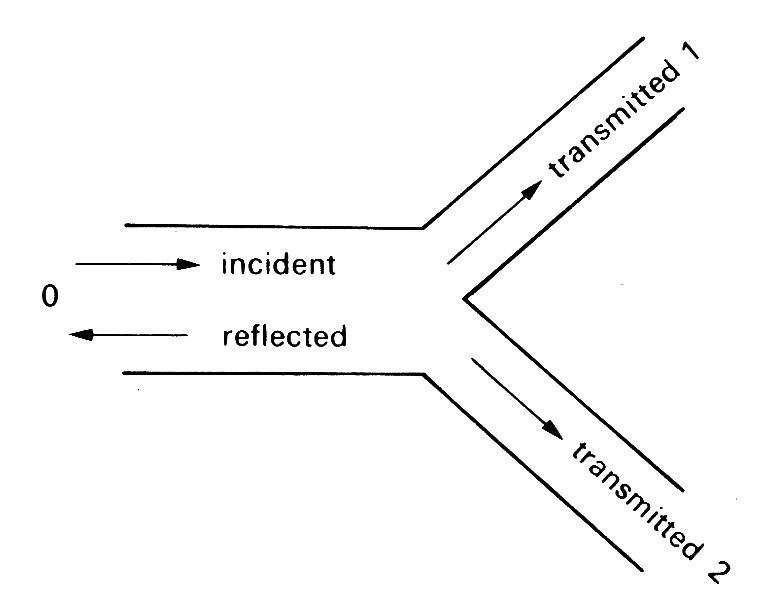
Fig. 12.23. Sketch of an arterial bifurcation. The incident wave is partially reflected in the parent tube 0 and partially transmitted in the daughter tubes 1 and 2.
The daughter tubes may be of different sizes (in the cardiovascular system they usually are) and may come off at different angles. A wave travelling down the parent artery will be partially reflected at the junction, so that a reflected wave travels back up the parent tube, and partially transmitted down the daughters. The properties of the reflected and transmitted waves can be predicted quite simply.
There are two conditions which have to be satisfied by the reflected and transmitted waves at the junction. First, the pressure in each tube must be the same. If this were not the case, a finite pressure difference would be acting on a small volume of blood, which would therefore experience an instantaneously large acceleration causing the pressure difference to disappear. Not only must the mean pressure be the same, but also the oscillatory part of the wave-forms must be the same in each tube. If the oscillatory pressure at the junction associated with the incident wave is p~I (we shall always denote the oscillatory part of the pressure wave-form by the symbol p~), if that associated with the reflected wave is p~R, and if those associated with the transmitted wave are p~T1 and p~T2, then at all times it is necessary that
p~I + p~R = p~T1 = p~T2 (12.13)
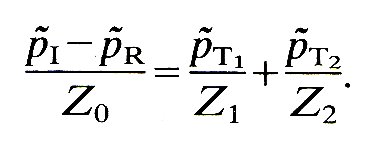
Secondly, mass must be conserved. That is, what goes into the junction must come out, i.e., the volume flow-rate into the junction from the parent tube must at all times be equal to the volume flow-rate out of it in the two daughters. (This assumes that the volume contained within the junction is so small that any change in it can be ignored.) Thus if we represent the volume flow-rate in the direction of propagation of the wave by the symbol Q, with the appropriate subscript, this condition requires that at the junction
QI - QR = QT1 + QT2 (12.14)
where QR has a minus sign because the reflected wave is travelling to the left in Fig. 12.23. Now we have seen already (§12.3.5) that the cross-sectional average velocity u in the direction of propagation of the wave varies with time in the same way as the excess pressure, and has an amplitude equal to that of the pressure pulse divided by rc. Hence the volume flow-rate Q, equal to Au, where A is the undisturbed area of the tube, is given by
 (12.15)
The quantities A, r, and c are properties of the artery in which the wave is propagating, not of the wave itself. This is also true, therefore, of the quantity rc/A, which is often represented by a separate symbol, Z:
Z = rc/A (12.16)
Z is called the characteristic impedance of the tube, defined as the ratio of oscillatory pressure to flow-rate in a tube when a single wave is travelling along it, and takes the same constant value at every point of the tube.* [*The word 'impedance' comes from electrical network theory, and is much used in cardiovascular physiology. It is analogous to 'resistance' in that it measures the amount by which flow through a system, in response to a known oscillatory pressure difference, is impeded by the system. Various different 'impedances' can be defined, and these are discussed in §12.10 in a more mathematical context.] The dimensions of Z are [M L- 4 T-1 ], and it can be measured in the units kg m- 4 s-1. The volume flow-rate condition (Equation (12.14)) can now be represented in terms of the oscillatory pressures and the impedances of the three tubes, as follows:
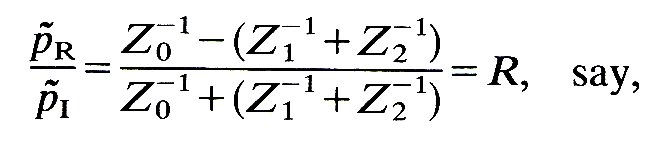
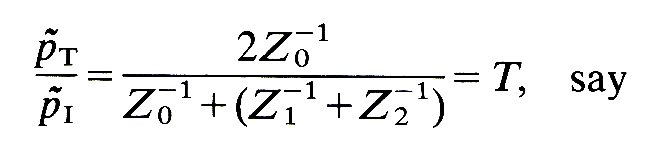
Equations (12.13) and (12.17) must be satisfied at the junction all the time. They constitute three simultaneous equations which can be solved to give the three unknown quantities, p~R, p~T1, and p~T2, in terms of the pressure at the junction in the known incident wave, p~I. The solution of these equations yields
 (12.18)
and
 (12.19)
where the subscript has been dropped from pT because, at the junction, p~T1 = p~T2. The reciprocal of the impedance Z-1 is often called the admittance, and we shall use this term when it is appropriate.
Equations (12.18) and (12.19) can provide a great deal of information. Let us first consider a particular form of incident wave, a sinusoidal one in which
p~I = p0 cos{w(t - x/c0)} (12.20)
and we choose the junction itself to be the origin of the x -coordinate in each tube. Thus x is negative in the parent tube, and positive in each daughter tube (see Fig. 12.23). At this stage it is not necessary to choose a particular wave shape but the cosine in Equation (12.20) is particularly simple and convenient.
At the junction, x = 0, the pressure in the incident wave is, from Equation (12.20), equal to
p~I = p0 cos wt.
From the form of Equations (12.18) and (12.19), this means that p~R and p~T are also proportional to cos wt at the junction. Furthermore, since we know that the reflected and transmitted waves are propagated in a similar manner to the incident wave, their dependence on x, as well as on t, follows:
p~R = Rp0 cos{w(t + x/c0)} (12.21)
p~T1,2 = Tp0 cos{w(x - x/c1,2)}
In the first of these equations, the sign of x/c0 is different from that in Equation (12.20) because the reflected wave travels in the negative x-direction. The second equation is applicable to either of the daughter tubes, with subscript 1 for tube 1 and subscript 2 for tube 2.
These equations tell us everything about the reflected and transmitted waves: (i) they are the same shape as the incident wave (sinusoidal); (ii) the amplitude of the reflected pressure wave is R times that of the incident wave, while that of the transmitted wave in each daughter tube is T times that of the incident wave; (iii) the wave-speeds of the reflected and transmitted waves are those appropriate to single waves in the tubes concerned (c0, c1, and c2 respectively); (iv) finally, the total oscillatory pressure in the parent tube is equal to the sum of that in the incident wave and in the reflected wave:
p~ = p~I + p~R
The theory of wave reflections at the junction between a parent or proximal tube and a pair of daughter or distal tubes can readily be extended to a situation in which more than two daughter tubes originate at the junction. Such a situation occurs, for example, where the two renal arteries branch off the aorta, or at the trifurcation of the canine aorta. A similar set of equations shows that just as it is the sum of the admittances (Z-1) of the two daughter tubes which governs the reflected and transmitted waves at a bifurcation, so it is the sum of the admittances of the three or more daughter tubes which governs them at a more complex junction. The quantity Z1-1 + Z2-1 in Equations (12.18) and (12.19) is replaced by Z1-1 + Z2-1 + Z3-1, etc.
The ratio of the amplitudes of the transmitted wave to that of the incident wave (T, Equation (12.19)) is positive. This means that the transmitted pressure wave is in phase with the incident wave at the junction, although its amplitude and wave-speed (c1 or c2) may change. The amplitude ratio of the reflected wave (R) may however be negative as well as positive, in which case the pressure in the reflected wave is at a minimum when that in the incident wave is at a maximum, and vice versa: i.e. the waves are 180° out of phase. Thus the sign of R is important, and must be investigated further.
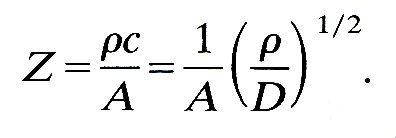
12.4.2 The matching of impedances. If the sum of the admittances (reciprocals of impedances) of the daughter tubes is equal to that of the parent tube, then R is zero, and there is no reflected wave. In this case the junction is said to be one at which the impedances are matched. We can examine the conditions under which this occurs by using the definition of impedance together with the relation of wave-speed to distensibility (Equation (12.9)), which give
 (12.22)
If the distensibility is given in terms of Young's modulus and wall thickness-to-diameter ratio by Equation (7.3b), this gives
 (12.23)
So if the daughter tubes have the same Young's modulus and wall thickness-to-diameter ratio as the parent (i.e. the same distensibility), the impedances will be matched if the sum of their areas is equal to that of the parent. However, if the daughters are slightly less distensible than the parent, as indicated by Table I in which E is seen to increase peripherally while h/d remains more or less constant, then their combined area must be somewhat greater than that of the parent for perfect matching. There is some evidence, as we shall see shortly, that many junctions in the cardiovascular system are quite well matched.
It is unlikely that any real arterial junction is perfectly matched, but if a junction is only fairly well matched, so that the magnitude of R is quite small but still measurable, then we can show that the amount of energy in the reflected wave is totally negligible, because it is proportional to the square of the amplitude. The rate W at which energy is carried along in a sine wave can be calculated quite simply, because most energy is transferred through the work done on the blood by pressure forces. This turns out at all times to be equal to the oscillatory pressure p~ multiplied by the oscillatory flow-rate Q, and since Q = p~/Z, the rate of energy transmission is given by
W = p~Q = p~/Z (12.24)
Although p~ is a pressure which oscillates periodically and has a zero mean value, as in Equation (12.20), its square does not have a zero mean. For example, the mean value of cos2 {w(t-x/c0)} averaged over a whole cycle, is 1/2 (see Fig. 12.24).
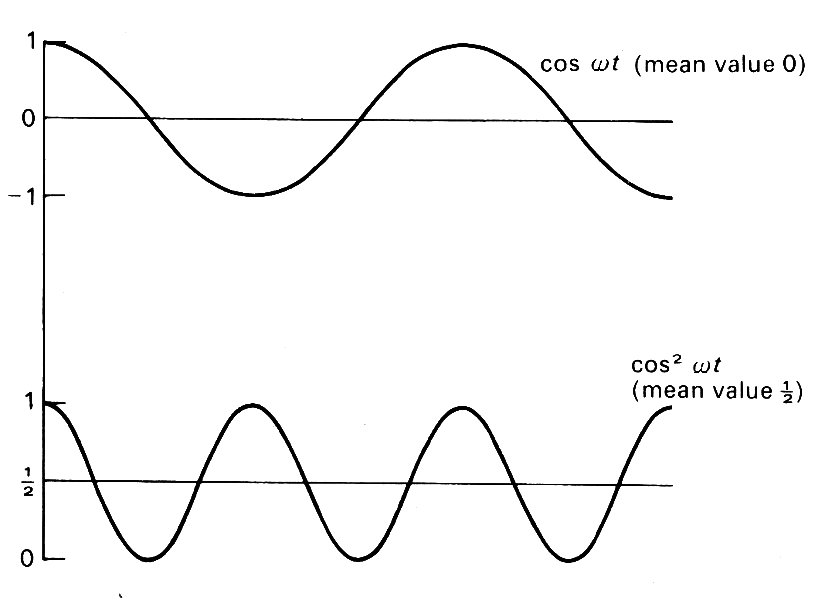
Fig. 12.24. A comparison between the graphs of cos wt and cos2w, showing the latter to have a mean value of 1/2 while the former has zero mean.
Thus the mean rate of energy transmission by the pressure wave at any cross-section W, is given by
![]()
when p~ has amplitude p0 as given by Equation (12.20).
We can therefore see that the mean rate of energy transfer in a reflected wave, relative to that in the incident wave, is equal to
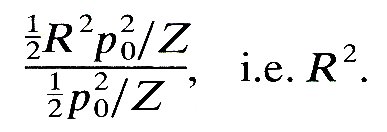
R2 is called the reflection coefficient (see §8.4). Similarly, the rate of energy transfer in the two transmitted waves, compared with that in the incident wave, is
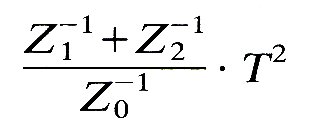
This quantity is called the transmission coefficient. From the definitions of R and T (Equations (12.18) and (12.19)) we can see that the sum of the reflection and transmission coefficients is 1, i.e. no energy is lost at a junction of this type.
Now suppose that a junction is slightly mismatched, so that Z1-1 + Z2-1 differs from Z0-1, by 5 per cent, say. In that case the fraction of energy reflected works out at 000006; i.e. most of it is transmitted. This means that even when perfect matching is not achieved, the mismatch has to be quite considerable before it has a significant effect on the energy transmission.
These conclusions are relevant to two types of 'junction' which occur in the cardiovascular system, (i) Junctions at which very small arteries branch off an otherwise unchanged large one (e.g. intercostal arteries off the aorta), (ii) Sites where the area or distensibility of a single tube changes by a small amount: the continuous tapering of most larger arteries can be treated as a succession of such sites, as discussed below (§12.4.7).
12.4.3 Positive and negative reflection. When matching is not perfect, R is either positive or negative. In the extreme case, when the sum of the admittances of the daughter tubes is much smaller than that of the parent (which would occur, for example, if their combined area were very small, and their distensibility were not much different), then R would be approximately 1. In these circumstances, we would expect the reflection to be similar to that at a closed end, across which no flow is possible. At a closed end, the reflected flow wave is 180° out of phase with the incident flow wave, and the amplitude of the pressure oscillation is doubled, the phase of the reflected pressure wave being unchanged; i.e.
QR = -QI , p~R = + p~I
and so R = 1.
If an observer measured the pressure at a fixed point in an infinitely long elastic tube, in which the single sine wave described by Equation (12.20) was propagating, he would measure the sinusoidal oscillation with amplitude p0. If a closed end were inserted, he would continue to measure a sinusoidal oscillation, but the amplitude would depend on his distance from it. At the closed end itself it would be 2p0, but would diminish as the observer moved away, until it became zero at a quarter of a wavelength from the end (see Fig. 8.11, §8.4: this point is called a node). Farther away, the amplitude would increase again, to a maximum of 2p0 at a half wavelength from the end (an antinode) and so on. If instead of a closed end there was a junction or other discontinuity for which R was positive but not equal to 1 (=0.8, say), the amplitude would not reduce to zero but to 0.2p0 at the nodes, and would be only l.8p0 at the antinodes (see Fig. 12.25).
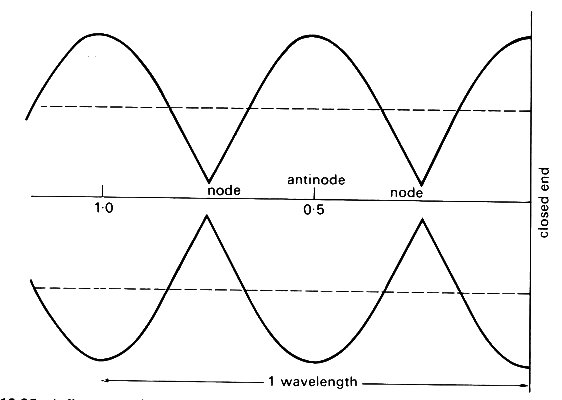
Fig. 12.25. A diagram to show how the amplitude of the oscillations varies with distance from a site of partial (80 per cent) closed end reflection. Dotted lines represent the amplitude of the undisturbed incoming wave.
This would be a partial reflection, of closed end type. It is interesting to note that when R is close to 1, T, given by Equation (12.19), is close to 2. This means that the amplitude of the pressure wave transmitted through an almost closed junction is twice that in the incident wave. This seems surprising until we recall that the flow-rate amplitude is equal to Z-1 times the pressure amplitude (Equation (12.15)), so that even when this is doubled, the transmitted flow-rate oscillation in this case is still very small. The doubled pressure amplitude in the daughter tube is merely the response to the doubled amplitude at the closed end of the parent tube.
Another extreme type of reflection occurs when the sum of the admittances of the daughter tubes is much greater than that of the parent, for example when the combined area of the daughter tubes is very large. In this case R is close to -1, while T is very small. The situation is similar to that at a completely free, open end, at which the oscillation in pressure has to be zero, since the pressure must be the same as that in the chamber into which the tube opens, and the oscillation in flow-rate is doubled. Here the pressure nodes are at the open end and a whole number of half wavelengths from it; the antinodes are at a quarter wavelength from the end, and thereafter at half wavelength intervals. The phase of the pressure wave is now reversed on reflection, while that of the flow-rate is unchanged. The phases in all cases of negative reflection, for which R is negative, are of 'open-end' type.
In summary, for positive reflection, the phase of the pressure-wave is unchanged, that of the flow wave is reversed, and the amplitude of the transmitted pressure wave is increased. For negative reflection, the phase of the flow wave is unchanged, that of the pressure wave is reversed and the amplitude of the transmitted pressure wave is reduced.
12.4.4 Physiological evidence of wave reflections. There have been a number of studies in which the pressure and flow pulses have been measured at various sites in the large arteries of man. Wave-forms from the ascending aorta, the descending thoracic and abdominal aorta, the common iliac, subclavian, innominate, and renal arteries (in man) are shown in Fig. 12.26. On the basis of the above discussion, we can predict certain features of the wave-forms which should be observed as a result of wave reflections.* [*The pattern of reflected waves observed at any site is likely to be species specific. The present discussion is applicable to man; the corresponding observations for the dog are given in Chapter 12 of D. A. McDonald's book, Blood flow in arteries, published by Edward Arnold (1974).] We first calculate the time after the beginning of systole at which (a) the pulse wave first reaches a certain site, and (b) reflected waves reach it. The site in the ascending aorta can be regarded as located at the exit from the ventricle. The pulse wave will reach the branches at the arch of the aorta, about 8 cm away, after a time calculated from the wave-speed there, about 5 m s-1 (Table I: measured wave speeds in man and dogs do not differ greatly). The time is therefore approximately 0.016 s, and the time which will have elapsed before a wave reflected from these junctions will return to the root of the aorta is only 0.032 s. But the initial part of systole during which the blood is accelerated and the pressure and velocity rise rapidly is normally about 0.1 s. Thus the reflected wave, not likely to be very large in amplitude because the total cross-sectional area downstream of the junctions is not very much greater than that upstream, will first arrive during this period of rapid pressure rise, and is unlikely to be perceptible.
Another major site of reflection which the wave encounters as it travels down the aorta, and the one with the largest reflection coefficient, is the aortic bifurcation. Measurements have shown that the total cross-sectional area of the two iliac arteries is commonly less by about 20 per cent than that of the abdominal aorta. Thus a significant positive reflection is expected. (This would not be true in a dog where the aortic trifurcation may be quite well matched.) Now the time of travel of the pulse from the heart to this point is the distance, about 60 cm in man, divided by the average wave speed in the aorta, about 6 m s-1. Thus the time of travel is about 0.1 s, and the reflected wave will return to the root of the aorta (and, equally, to the measurement sites in the innominate and subclavian arteries) in about 0.2s. Measurements of the velocity in the core of the tube (representative of the flow-rate because the velocity profile is fairly flat: see §12.8.1.) reveal that the descending part of the wave-form has a step in it, representing a momentary enhancement, followed by a slowing down of the deceleration (see Fig. 12.26).
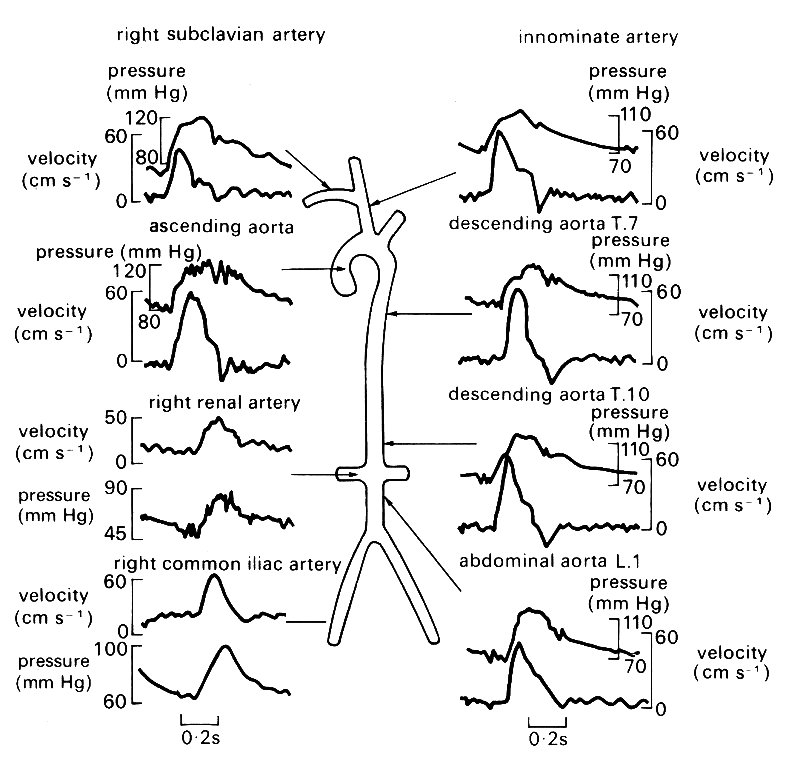
Fig. 12.26. Simultaneous pressure and blood velocity wave-forms at numerous points in the human arterial tree. (All were taken from one patient with the exception of the right renal artery and the right common iliac artery.) (After Mills et al. (1970). Cardiovasc. Res. 4, 405.)
This step occurs at a time after the start of systole which increases in proportion to the distance up the aorta from the aortic bifurcation, and reaches a value of about 0.2 s in the innominate artery. We may therefore interpret it as a mark of the reflected wave. Now the iliac bifurcation is expected to be a site of positive, or closed-end, reflection. This means that the flow-rate in the reflected wave is out of phase with that in the incident wave, and the positive peak of the incident wave will correspond to a negative trough of the reflected wave. It is easy to see that such a trough would cause an enhanced deceleration in the aortic waveform, as observed.
The pressure wave-forms of Fig. 12.26 contain so many fluctuations that it is difficult to interpret any one as the reflected wave from the aortic bifurcation. The notch at the end of systole marks the closure of the aortic valve, and is propagated away from the heart with the basic pulse, although it is rapidly attenuated (see §12.6.2.). Note also how the amplitude of the pressure pulse increases with distance from the heart (by about 60 per cent along the length of the aorta, Fig. 12.19), while that of the flow-rate pulse falls. This is consistent with a closed-end reflection at the aortic bifurcation, although it may in part be due to the gradual tapering and stiffening of the aorta which is discussed in the next section.
Another phenomenon which may occur in a system in which waves are travelling is resonance, which was described in §8.4. At a quarter wavelength from a site of closed-end reflection there should be a point (a pressure node) at which the pressure amplitude is a minimum and the flow amplitude a maximum (see Fig. 12.25). A similar point occurs every further half wavelength from the reflection site. In between there are the antinodes at which the pressure amplitude is a maximum. If either an antinode or a node falls at a second reflection site, for instance at the other end of a finite tube, then another antinode will occur at the original site. The pressure amplitude there, already high because of the positive reflection, is further augmented by each successive reflection. This is the condition called resonance, which should be observed if the length of the system is equal to a whole number of half wavelengths. The wavelength of the basic wave-form in the aorta is much larger than the length of the vessel, so we do not expect to see resonance of the whole wave-form. However, the fourth harmonic of the basic wave has a wavelength only about twice the length of the aorta in man, while the sixth harmonic has this property in dogs. We must, therefore split the wave-form into its sinusoidal components by Fourier analysis, to see if the amplitude of the fourth harmonic (sixth in dogs), is disproportionately high. Even for these components, however, no evidence of resonance can be seen in practice (Fig. 12.20). This is probably because they are attenuated too rapidly to remain significant after several reflections (see §12.6.2).
So far we have concentrated on major arterial branches, but there are also sites where small side branches come off a large artery (Fig. 12.27), e.g. the intercostal and coronary arteries branching off the aorta.
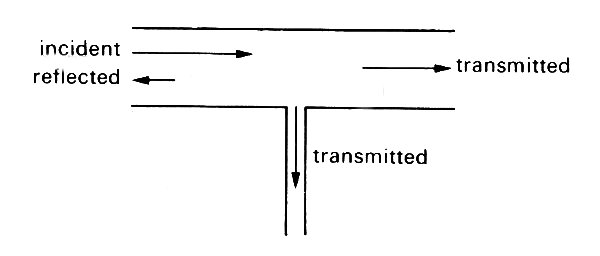
Fig. 12.27. A junction in which the parent tube continues unaltered after a small tube has branched off (cf. the junction between an intercostal artery and the aorta).
Here the impedance of one daughter tube is the same as that of the parent, while that of the other (or others) is very small. Thus the sum of the admittances of the daughters is only slightly greater than that in the parent, and the junction is almost matched. This means that a negligible amount of energy is reflected (§12.4.2), so that the basic wave-form in the aorta is effectively undisturbed, while the pressure pulse in the small branch is as large as that in the aorta (Equation (12.19)). This is observed in practice.
12.4.5 Multiple reflections. The relationship between the pressure and flow-rate wave-forms proximal and distal to a single junction can be explained without reference to the rest of the arterial system. However, for a detailed interpretation of the measured wave-forms at any one position, for example in the ascending aorta, it is necessary to recognize that there are many sites of reflection in the system, situated at widely different distances from the measurement point. It is therefore necessary to examine the influence of repeated reflections on the wave.
Consider first the double junction illustrated in Fig. 12.28.
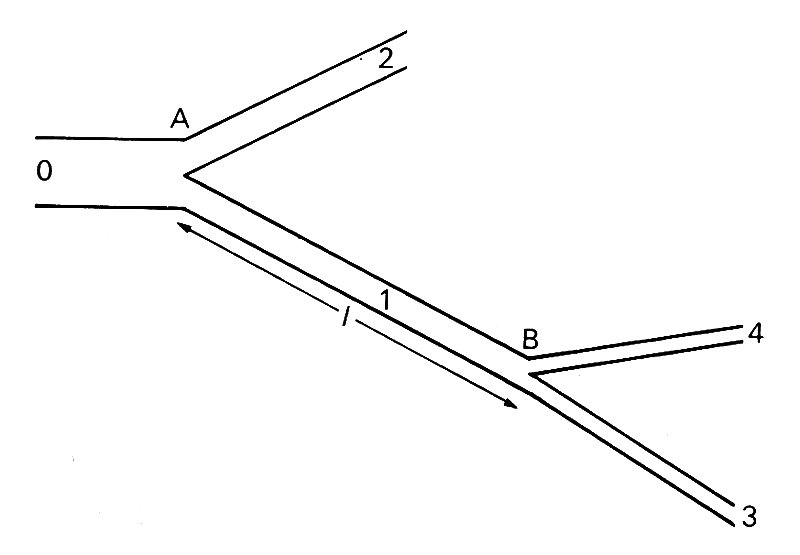
Fig. 12.28. Sketch of a double junction. Wave incident in tube 0 is reflected and transmitted at A. The transmitted wave in 1 is reflected and transmitted at B. The reflected wave in 1 is again reflected at A, etc.
A wave reflected once at junction B is reflected a second time at junction A, and so on. The amplitudes of the reflected and transmitted waves on each occasion are determined by the characteristics of the junction. If junction B is fairly well matched, the wave reflected from it will have small amplitude. When reflected again at A it will have even smaller amplitude, though not very much smaller, for if A is well matched for waves incident in the parent tube, it will not be so for waves incident in a daughter. In any case, the amplitude of that part of the wave trapped in the tube AB will be very small after only a few reflections, and that will be true even in the absence of attenuation.
The only exception to this conclusion would occur if the length cf the tube AB were equal to a whole number of half wavelengths of the wave. In that case resonance would occur. From the point of view of a wave incident from the parent tube of junction A, this means that no energy is required to drive the oscillation in AB, and the waves transmitted at B have the same characteristics as they would have if AB were not there. The tube AB can pass waves on without modification.
If, on the other hand, the length of the tube AB were close to an odd number of quarter wavelengths, the reflected wave would on each occasion be exactly out of phase with its predecessor if the reflection at B were positive, and in phase if negative; the amplitude of the transmitted wave would be diminished for a positive reflection and enhanced for a negative one.
In general, these extremes would not be met with, but the details of the reflected and transmitted wave will still depend on the relative magnitude of the length l of the intermediate tube and the wavelength of the wave in that tube. It is this which governs the time delay, and hence the phase difference, between a wave leaving A and returning there again after reflection at B. This means that the behaviour of a wave as it passes two or more junctions depends on its frequency. Thus the behaviour of a composite periodic wave, made up of a number of sinusoidal components of different frequencies (cf. Fig. 8.14, §8.6), is likely to be quite complicated, and the shape of the wave transmitted through the double junction will be different from that of the incident wave. The only components which will be unaffected, apart from those for which l is approximately a whole number of half wavelengths, are those whose wavelength is much greater than l, for then the two junctions and the tube between will all seem like part of a single reflection site as far as the wave is concerned. In the cardiovascular system, the length of the longest artery, the aorta (60 cm in man, 40 cm in dogs), is quite small compared with the fundamental wavelength (about 5 m and 3 m respectively), so it is only the higher harmonics which will be affected by this process, and it is their contribution to the total wave-form which we expect to change significantly.
In the last section, we were able to calculate the details of wave reflection and transmission at a single junction. It is possible to use the same conditions, continuity of pressure and flow-rate at every junction, to calculate similar details, for waves of a single frequency, at multiple junctions. For example, if we know what waves are present in tubes 3 and 4 of Fig. 12.28, we can calculate what is happening in tube 1. If we have also calculated the waves in tube 2 in the same way, we can combine the two results, evaluating pressure and flow-rate at A, to calculate the details of the wave in tube 0. Furthermore, if that tube itself began at another junction, we can repeat the process to analyse the details in the parent tube of that junction, and so on. In this way we can calculate the pressure and flow-rate everywhere in a complete network of branched tubes, as long as we know the relationship between pressure and flow-rate in the smallest tubes, and the lengths and characteristic impedances of every tube in the system. In order to do this calculation for the arterial system, we could for example assume that the flow-rate is proportional to the pressure-gradient in the vessels of the microcirculation (i.e. constant peripheral resistance). At present, however, such a calculation is not practicable, because the necessary anatomical data on the intermediate arteries are not available. A calculation has been performed for a model of the arterial system, consisting of several generations of branched tubes. The branches of any one generation were taken to have the same diameter and visco-elastic properties, but their lengths were distributed randomly, and the wave-speed and cross-sectional area were taken to increase towards the periphery. The results of this calculation will be given below.
Even if we do not know the waves present in the terminal branches of the system, such calculations enable us to predict the relationship between pressure and flow-rate everywhere in the system. That is, given the pressure wave-form at a point, we can calculate the flow-rate wave-form, and vice versa. Also, if we measure the pressure and the flow-rate at a point we can infer some of the properties of the system. For waves of a single frequency, the relationship can be described by two constants: one is the ratio between the amplitudes of the pressure and flow-rate oscillations of that frequency, often given the symbol M, and the other is the phase lag q of the flow-rate oscillation behind the pressure oscillation. Thus if the component of the pressure oscillation at the entrance to the system with angular frequency w is p cos wt, the flow-rate oscillation will be (p/M) cos (wt - q). The complete results for a system can be given by plotting graphs of M and q against w, so that the behaviour of any wave made up of sinusoidal components can be described. For example, if the pressure and flow-rate wave-forms are measured in the ascending aorta, a Fourier analysis can be performed on each, and the amplitude and phase of every flow-rate harmonic can be compared with those of the corresponding pressure harmonic. Thus the values of M and q for each frequency present in the wave-forms can be inferred. Many experimental results are expressed in this way.
The quantity M, being the ratio of a pressure and a flow-rate, has the dimensions of an impedance. However, since it depends on the position of the point of measurement as well as on the frequency of the wave, it is not the same as the characteristic impedance of the tube in which the measurements are made (i.e. the aorta). Together with q, it represents the effective impedance, at the point of measurement, of the whole system for waves of frequency w. In fact M is usually called the modulus of the effective (or input) impedance of the arterial system, and q is called its phase. These terms arise from a description of waves in terms of complex numbers, which we have hitherto tried to avoid. They are explained further in the Appendix to this chapter, along with various other quantities which are sometimes given the name 'impedance'. The proliferation of such quantities can be very confusing, and we hope that the Appendix will serve both as a clarification of the subject and as a warning not to use the word 'impedance' without a qualifying adjective like 'characteristic' or 'effective'.
12.4.6 Interpretation of observed pressure wave-forms in large arteries. The idea of the effective impedance of the cardiovascular system for pressure waves of different frequencies makes it possible to interpret the measured pressure pulse in the aorta and other large arteries much more fully than is possible by mere inspection of the wave-forms. Only the gross effects, like the presence of a single powerful reflection site, can be observed in that way. For more detailed information, it is necessary to split the pressure and flow-rate wave-forms at the observation site into their different frequency components. The amplitudes and phases of the flow-rate harmonics are then compared with those of the corresponding pressure harmonics and the results expressed in terms of the modulus M and phase q of the effective impedance. These quantities are then plotted against frequency.
Certain information can be inferred from such graphs. For example, if the system consists simply of a single uniform tube with a termination at one reflection point, then Equation (12.32) (in the Appendix) indicates that when the measurement site is a quarter wavelength from the reflection site, the intervening piece of tube has no effect on the effective impedance. In that case the magnitude of the effective impedance, M, is a minimum. Furthermore, if the frequency is increased beyond that for which l is a quarter wavelength, then the phase of the effective impedance (q) changes from negative to positive. These considerations have led experimentalists to plot M and q against w, and to infer that, when M is a minimum (and q is zero), there is a site of reflection at a distance of pc/2w from the measurement site, where c is the independently measured wave-speed in the vessel. In a complicated branched network, such interpretations are inevitably much more tentative. The reflection site inferred in this way almost certainly does not correspond exactly to an actual bifurcation because of the influence of all the other junctions. The reflected wave will be a complicated resultant of reflections from many sites. However, if there is, anatomically, one dominant junction (e.g. the aortic bifurcation), and the inferred reflection site is close to it, it can legitimately be regarded as the principal site of reflection.
The sort of graphs which are normally obtained from measurements in the ascending aorta of man are shown in Fig. 12.29.
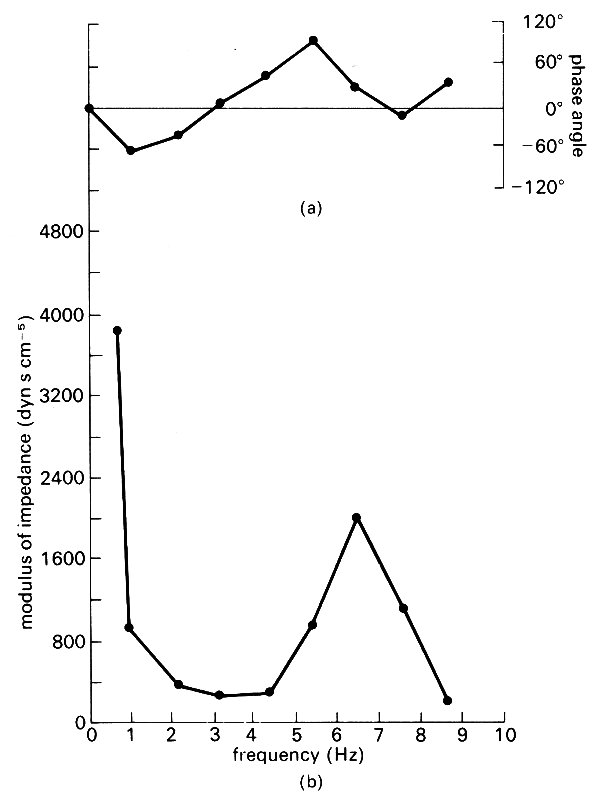
Fig. 12.29. Graphs of (a) phase and (b) modulus of the input impedance of the human ascending aorta, plotted against wave frequency/. The single minimum of the modulus suggests that there is a single effective reflection site at a peripheral location. (From Mills et al. (1970). Cardiovas. Res. 4, 405-17.)
These were taken from the same set of measurements as the wave-forms shown in Fig. 12.26. There is a minimum of M at a frequency of 3 Hz, and calculation shows that this implies the presence of a reflection site roughly at the level of the aortic bifurcation. Measurements at different sites in the aorta lead to the same conclusion.
Another universal feature to be seen from Fig. 12.29 is the very large value of M (with q=0) for very small frequencies. The zero frequency component of the wave represents the mean flow, and this real, large value of the effective impedance represents the resistance experienced by that mean flow. We therefore see that the 'opposition' to the first few harmonics of the pulse wave is much less than to the mean flow. But these harmonics contain most of the pulse energy. This implies that the amount of work required to drive the oscillatory motions in the aorta is not very much in excess (about 10 per cent) of that required to drive the same mean flow steadily.
Similar measurements in the ascending aorta of a dog are shown in Fig. 12.30.
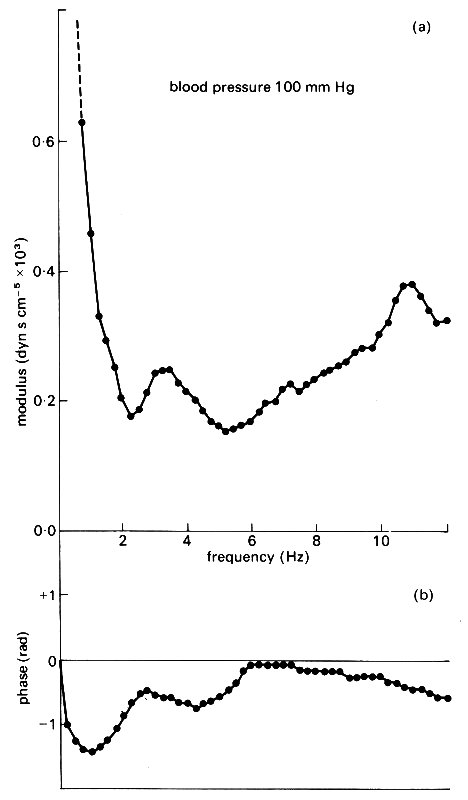
Fig. 12.30. Graphs of (a) modulus and (b) phase of the input impedance of a dog's ascending aorta plotted against wave frequency f. The appearance of two minima of the modulus suggests the presence of two effective reflection sites at different distances from the heart. (After O'Rourke and Taylor (1967). 'Input impedance of the systemic circulation'. Circulation Res. 20, 365-80.)
They have a slightly different appearance, in that there are two minima of the impedance modulus. These have been interpreted in terms of two distinct reflection sites at different distances from the heart. Since the second minimum is absent in the descending aorta, it has been inferred that the second major reflection site is in the upper part of the body, i.e. in that part of the circulation supplying the head and fore limbs. This has led to a model of the systemic circulation consisting of an 'asymmetric T (Fig. 12.31),
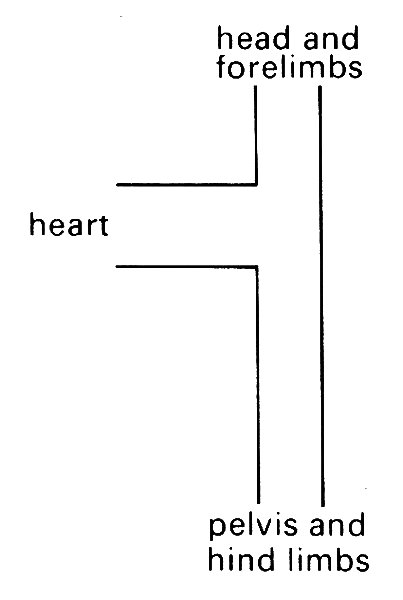
Fig. 12.31. The 'asymmetric T model of the systemic circulation, proposed by O'Rourke to explain the results of Fig. 12.30. The nearer reflection site is associated with the head and forelimbs, the further site with the pelvis and hind limbs. (From O'Rourke (1967). 'Pressure and flow waves in systemic arteries and the anatomical design of the arterial system' J appl Phvsiol 23, 148.)
in which two such reflection sites are incorporated. Certainly, the observations in a dog's aorta can be interpreted in terms of such a model, but the system is really so complicated that it should be used with caution. The apparent absence of the upper reflection site in man may be a consequence of a number of factors, such as (a) a smaller proportionate blood flow in the upper part of the body, so that the reflected wave is insignificant, (b) better matched junctions in the upper part of the body, (c) a difference in the anatomy of the aortic branches of the two species (three branches from the arch in man, two in dogs), (d) the fact that the measurements in man were made on patients in whom heart disease had been diagnosed. Perhaps in healthy man the second minimum of M would appear.
From measurements in the femoral artery of a dog, an effective reflection site just below the knee has been inferred. Such measurements have also revealed that the ratio between the impedance modulus of the first few harmonics and the resistance offered to the mean flow is larger in the femoral artery than in the aorta. This is a consequence of the smaller distensibility of more peripheral vessels.
The only theoretical prediction which can be compared with the experimental results shown in Figs 12.29 and 12.30 is that obtained from the model described in §12.4.6, in which the arterial system is replaced by an assembly of randomly branching tubes. The calculated results are given in Fig. 12.32.
It can be seen that the main feature of the experimental results at lower frequencies are reproduced, but that there is little detailed agreement.
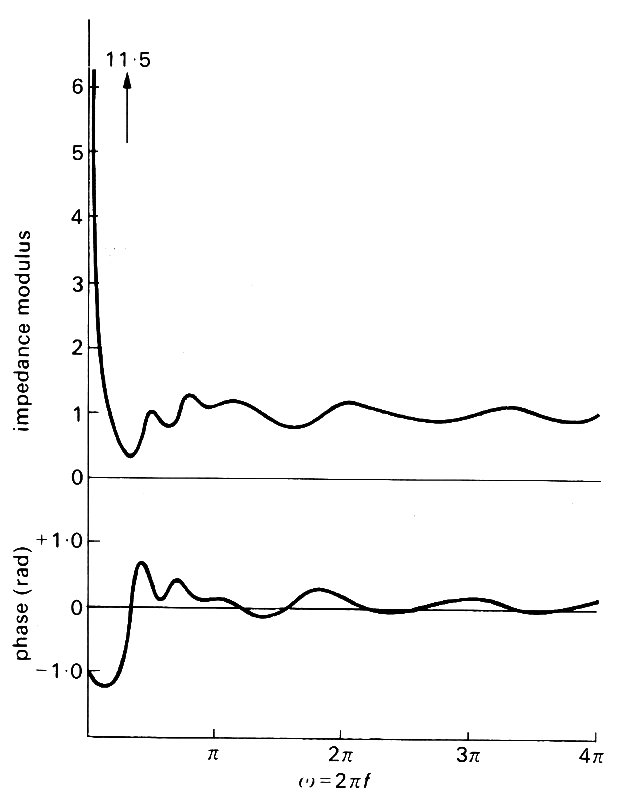
Fig. 12.32. Predictions of the modulus and phase of the input impedance of a systemic arterial tree. They should be compared with the observations recorded in Figs 12.29 and 12.30. The units for the modulus are chosen so that the characteristic impedance of the aorta has modulus equal to 1. (After Taylor (1966). 'The input impedance of an assembly of randomly branching elastic tubes'. Biophys. J.. 6, 29-51.)
12.4.7 The effect of taper. We can use the relatively simple theory for reflections at isolated sites to describe what happens to waves in a tube whose cross-sectional area and distensibility both vary continuously with distance along the tube. The description can then be applied to waves in large arteries like the aorta, which both taper and become stiffer towards the periphery. The effect of the taper, together with the changes in wave amplitude caused by reflection from the iliac junction, explains why the pressure pulse increases in amplitude (Fig. 12.19) although the peaking is rather less than this simple theory predicts.
In order to use the theory, we treat the taper as a series of separate reflection sites distributed throughout the length of the artery (Fig. 12.33).
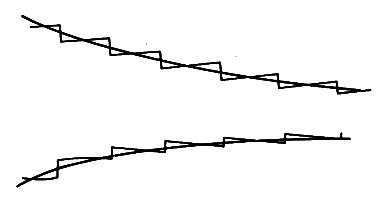
Fig. 12.33. A gradually tapering tube, represented by a succession of small discontinuities, each of which gives rise to negligible reflection.
All components of the wave will be repeatedly reflected at each site; the combined effect is equivalent to a continuous, gradual modification of the original wave, so that its amplitude, shape, and propagation speed vary with distance down the tube. If the variation in wall properties is gradual enough, the analysis of the change in shape of the wave becomes very simple, because each of the reflection sites which make up the continuous variation corresponds to a very small change in the characteristic impedance of the tube. Therefore the amplitude of the reflected wave at each site is also small, and the amount of energy reflected is smaller still (see §12.4.3). This means that almost none of the energy is reflected as the wave travels along a slowly varying tube, and we may analyse the wave's development as if all the energy were transmitted.
The rate of transmission of energy in a travelling pressure wave is given by Equation (12.24) to be equal to the square of the amplitude p divided by the characteristic impedance of the tube, Z. If all the energy is transmitted, this ratio remains constant, i.e.
p~ = constant x Z1/2 (12.25)
Thus in a gradually tapering artery, the amplitude of the pressure wave is proportional to the square root of impedance.
Finally we see from Equation (12.22) that the impedance of a tube increases if either its cross-sectional area A or its distensibility D decreases. Thus in the aorta, where both A and D decrease towards the periphery, the amplitude of the pressure wave is predicted to increase. The amplitude of the aortic flow pulse, equal to p~/Z (Equation (12.15)), will correspondingly decrease, being proportional to Z-1/2.
The cross-sectional area of the abdominal aorta is about 40 per cent of the area of the thoracic aorta, as can be seen from the values of the diameters given in Table I. Furthermore, the Young's modulus is about twice that of the thoracic aorta. Hence the impedance of the abdominal aorta is about 3.5 times that of the thoracic aorta (Equation (12.23)), and the amplitude of the pressure pulse is predicted to increase by about 85 per cent. A further increase in amplitude is to be expected as the pressure pulse approaches the isolated reflection site at the iliac junction (§12.4.4), so the eventual prediction is that the amplitude of the pulse should be at least doubled as it travels the length of the aorta. That the actual peaking is not so great may be attributed to two factors, (i) inaccuracy of the present analysis, and (ii) attentuation of the wave by viscous and visco-elastic energy dissipation. The second of these factors will be examined in §12.6; here we briefly consider the first.
The present theory accurately predicts the increase in pressure wave amplitude along a tapered tube as long as a negligible amount of energy is reflected. If the tube tapers too sharply, significant energy will be reflected, and the predicted peaking will be diminished. The criterion for this theory to be accurate, then, is that the length of tube over which the taper takes place should be great enough to encompass several wavelengths of the wave. This is clearly not true for the first few harmonics which make up the pressure pulse, for their wavelengths exceed the length of the aorta, and therefore it is not surprising that the actual peaking is less than predicted.
We have hitherto assumed that the arterial system behaves in a linear way, so that the propagation and reflection of single components of the composite pressure wave can be treated independently of the other components. This assumption is based on the approximations (i) that the average blood velocity u is always small compared with the wave-speed c, and (ii) that the pulse pressure is small compared with the mean excess pressure in the arteries, so that the distensibility does not vary during passage of the pulse. It was shown in §12.3.5 that in the largest arteries, the aorta and pulmonary artery, these may not be good approximations, and the actual passage of the pulse might be perceptibly modified by non-linearities.
The non-linearities take two forms. One, elastic non-linearity, is a consequence of the curvature of the stress-strain curve (cf. §7.2), which shows that an artery becomes stiffer, i.e. its distensibility D decreases, as the distending pressure is raised. This means that the wave-speed c, predicted from Equation (12.9), increases. This prediction has been confirmed both in vitro, using segments of artery, and in vivo, using short trains of high frequency pressure oscillations, generated in a dog's aorta during diastole, with different values of diastolic pressure. The wavelength of such oscillations is short, so that several cycles can be recorded at a downstream observation site before the reflected wave from the iliac junction returns to that site and distorts the recording. The results of such an experiment are shown in Fig. 12.34,
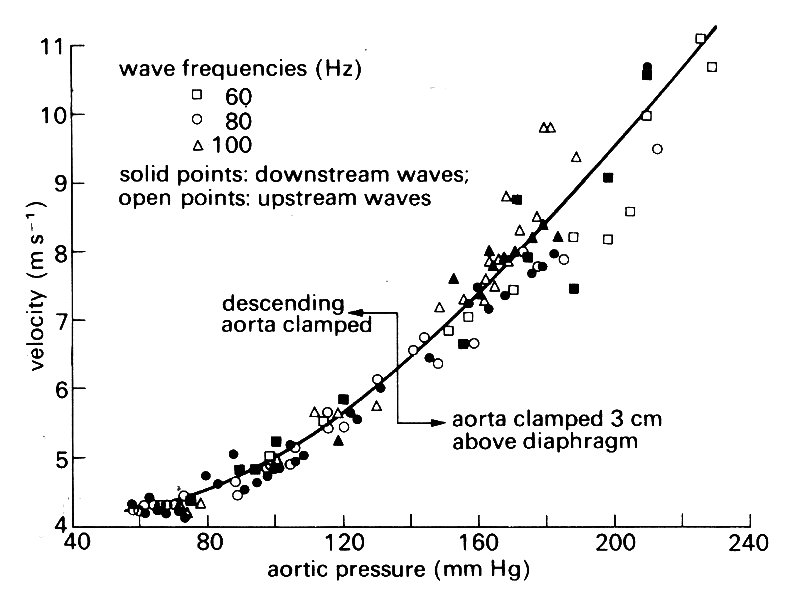
Fig. 12.34. Measured values of the wave-speed in a dog's aorta, plotted against pressure in the aorta. High frequency waves were introduced during diastole; diastolic pressure was controlled by occluding the aorta at different locations. (From Histand and Anliker (1973). Circulation Res. 32, 524.)
and show that there is a significant difference between the wave-speed associated with the maximum pressure achieved during a normal pulse in systole, and that associated with normal diastolic pressure. Thus the basic pulse-wave itself will move more rapidly in systole than in diastole.
There is also a fluid dynamic source of non-linearity, which will be important if u/c is not small. The wave can be shown to travel with speed c relative to the local fluid speed, and not relative to the tube wall. Thus, if the blood has a certain velocity u, the forward-moving part of the wave will have a speed c+ii, while the backward-moving part, returning from some more distal reflection site, will have a speed c - u. This has also been confirmed, again by observing small, high-frequency waves superimposed on the basic pulse at different points of the cycle, and measuring their speed of propagation both up- and down-stream. The effect of this phenomenon on the basic pulse itself is to enhance the forward wave-speed during systole, when the blood speed is greatest, relative to its value during diastole. Thus this too has the effect of speeding up the early part of the wave relative to the later parts.
From both sources of non-linearity, therefore, we deduce that the forward wave-speed during early systole is greater than that during diastole. Thus, as the wave is propagated downstream, the peaks of pressure and velocity tend to overtake the troughs, causing the front of the wave to become steeper. This steepening effect can be seen from simultaneous measurements of the pressure pulses at different positions along the aorta and in other large arteries (Fig. 12.14). In normal subjects it is not thought to be of any great importance. However, in patients whose arteries are abnormally distensible (so that c is low) or in whom the amplitude of the pulse is very large (so that u and Dpe/pe are large), it can be quite important. In such patients, the steepening occurs more rapidly, and a situation may arise in which the pressure peak catches up with the trough, and the wavefront becomes very steep.
Phenomena such as this are familiar in other types of wave and cannot be described by linear theory. For example, when the front of a water wave becomes vertical, it breaks, usually in a frothy, turbulent manner, with considerable dissipation of energy, When a sound wave becomes so strong that the pressure peaks catch up with the troughs, a shock wave is formed, in which much energy is dissipated thermally. In each case, a balance is struck between the non-linear steepening effect and dissipation, so that a steady state is set up. (When the amplitude of a water or sound wave is quite small, the tendency to steepen is not very strong, and the small dissipation associated with the basic wave motion is enough to counteract it.) So, in the arterial system, we can predict that if the amplitude of the pulse is great enough, some sort of 'shock' wave may develop. Some computer models of non-linear wave propagation in the arteries have predicted the development of 'shocks' in patients suffering from aortic valve incompetence, in whom the output of the left ventricle is very large, and so u is large. No-one, either theoretically or experimentally, has yet studied the detailed dynamics of such shocks, nor discovered a mechanism of vigorous energy dissipation analogous to turbulence in a water wave. However, 'pistol-shot' sounds are sometimes observed in the arteries of patients with aortic valve incompetence, which may well be the outward sign of the passage of a 'shock'.
The vessels in the venous and pulmonary arterial systems are rather more distensible than the systemic arteries and experience pressure fluctuations which are a larger fraction of their mean pressure. Therefore non-linearities may be of greater significance in those vessels, but there have been very few detailed studies, so little evidence is available. The topics are dealt with in separate chapters devoted to these vessels, Chapters 14 and 15.
We now have a satisfactory understanding of the mechanisms of propagation of the pressure pulse, and of the changes in the pressure wave-form which occur as it travels along the arteries. Apart from the steepening of the wave-front, all such changes are described by the linear theory. However, none of the factors considered above can explain the shape of the flow-rate wave-form (Fig. 12.19), which is predicted by the linear theory to be the same as that of the pressure wave-form and in phase with it (see footnote in §12.3.5). Only when blood viscosity is taken into account can the observed shape be explained.
Viscosity is also important in the attenuation, or damping, of the pressure wave. We have seen already (Chapter 8, §8.3 that waves in any real system must be attenuated, because the inevitable presence of friction or viscosity causes their mechanical energy to be dissipated into heat; in fact visco-elastic 306 The systemic arteries dissipation in the vessel wall proves to be more important than viscous dissipation in the blood.
12.6.1 Effect of blood viscosity on flow-rate wave-form. The pressure and flow-rate wave-forms, measured simultaneously in the femoral artery of a dog, are shown in Fig. 12.35.
Fig. 12.35. The pressure and flow-rate wave-forms measured simultaneously in a dog's femoral artery. Also shown are the wave-form of pressure gradient (below) and the flow-rate wave-form calculated from it using the theory for a rigid tube (broken curve). (After McDonald (1974). Blood flow in arteries. Edward Arnold, London.)
They are approximately the same shape during the acceleration phase of systole, but thereafter they diverge considerably. Furthermore the peak flow-rate has an appreciable phase lead over the peak pressure, while the simple non-viscous theory predicts that the two wave-forms should be in phase. The effect of viscosity is therefore considerable.
To understand how viscosity produces its effect, it is once more necessary to use Fourier analysis, and to consider the relationship between a sinusoidal pressure wave-form and the corresponding sinusoidal flow-rate wave-form. In fact, as discussed in Chapter 4, it is the local pressure gradient, not the pressure itself, which determines the flow. However, if a sinusoidal pressure wave is described by the equation
p~ = p0 cos [w(t-x/c)]
(cf. Equation (12.20)) then the pressure gradient acting in the x-direction, -dp/dx, is equal to
- w p0/c sin [w(-x/c)]
This is also sinusoidal, with the same angular frequency w, and has a phase lead of p/2 or 90° over the pressure (see §8.1 for a definition of phase lead and phase lag; what the phrase means here is that, at a given value of x, the pressure gradient reaches its peak at a time p/2w in advance of the pressure). We have already discussed, in Chapter 5, how the flow in a straight rigid pipe responds to the action of a sinusoidal pressure gradient. The same analysis proves to be applicable in arteries, because the walls remain approximately parallel even though they are not rigid. (See §12.8.2.)
The shape of the flow-rate wave-form, in response to a sinusoidal variation of pressure gradient, is also sinusoidal, with the same frequency (because the relationship is linear), but its amplitude and phase depend on the Womersley parameter a (see §12.3.3). If a is large, the boundary layer is very thin compared with the tube radius, and the flow-rate responds to the pressure gradient approximately as in a non-viscous fluid. However, if a is small, viscosity is important throughout the tube, and the flow-rate is at all times related to the pressure gradient as in Poiseuille flow. The detailed relationship has been worked out for all values of a. As reported in §12.3.3 the value of a is large (over 10) in the largest arteries of large mammals, but becomes very much less than 1 in the microcirculation.
In order to test the relevance of rigid tube viscous flow theory in an artery, it is necessary (i) to split the measured wave-form of pressure gradient into its harmonic components, (ii) to calculate the flow-rate corresponding to each component of the pressure gradient, and (iii) to combine the sinusoidal flow-rate components into the predicted flow-rate wave-form. This can then be compared with the measured one. Such a comparison for the wave-form in a dog's femoral artery is shown in Fig. 12.35. (The value of a associated with the fundamental heart-rate is 1.4, which is not very much in excess of 1.) Only four harmonics were used in making the prediction, but nevertheless the agreement is very good, apart from somewhat smaller oscillations during diastole than are actually observed. It is thus clear that rigid tube theory is very good for predicting the flow-rate corresponding to a given oscillatory pressure gradient, although vessel elasticity has a strong influence on that pressure gradient wave-form, and viscosity does not (see §12.3).
12.3.2 Effect of viscosity on wave propagation. Viscosity has the effect both of reducing the speed of propagation of the pressure wave and of attenuating it. Both effects come about because the relative longitudinal motion (slip) between the blood and the wall, which is predicted by non-viscous theory, is prevented in a viscous fluid. This means, firstly, that a slightly smaller oscillatory flow-rate is associated with the same oscillatory pressure gradient; thus there is an increase in the effective inertia of the fluid, which reduces the wave-speed. Secondly, high shear rates are generated in the boundary layer, causing energy dissipation and hence wave attenuation. Because the thickness of the boundary layer and the shear-rates within it depend on the value of a the magnitude of the wave-speed c, and the amount of attenuation per wavelength are also expected to depend on a.
The way in which wave attenuation can be described quantitatively was explained in §8.4. A sinusoidally fluctuating component p of the pressure wave will vary with time t and distance x along the vessel as follows:
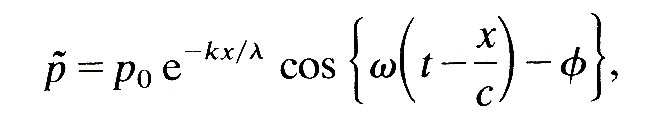 (12.26)
where p0 is the pressure amplitude, f is a phase angle, c is wave-speed, w is the angular frequency, and l (= 2pc/w) is the wavelength. The rate of attenuation is then represented by the constant k, since e- k is the factor by which the amplitude is reduced as the wave travels over a distance equal to l. A detailed theory of the effects of viscosity indicates that c and e-k vary with a in the manner shown in Fig. 12.36.
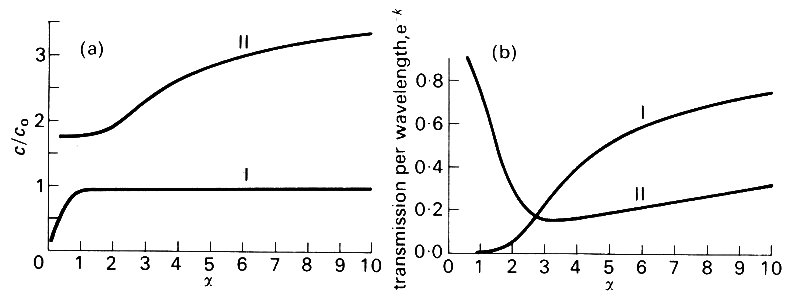
Fig. 12.36. (a) Predicted wave-speed c divided by the Moens-Korteweg wave-speed Co plotted against a. The lower curve corresponds to transverse pressure waves, the upper curve to longitudinal shear waves (see §12.7).
(b) Predicted variation of the transmission per wavelength (the attenuation factor e-k ) with a. Curve I corresponds to pressure waves and curve II to shear waves. (After Atabek (1968). 'Wave propagation through a viscous fluid contained in a tethered, initially stressed, orthotropic elastic tube.' Biophys. J..8, 626-49.)
We see from these curves that the wave-speed remains approximately equal to the Moens-Korteweg wave-speed c0 §12.3.4) for all values of a greater than about 1.5. Thus, in large mammals, where the value of a corresponding to the fundamental heart beat frequency is greater than 10, all components of the wave will travel with the same speed in the aorta. In much smaller arteries, however, where the fundamental value of a is less than 1.5, Fig. 12.36 (a) shows that the higher frequency components will move with greater speeds. This phenomenon, called dispersion, is another way in which a composite wave can change shape as it propagates. As we have seen, however, it is expected to be insignificant in large arteries.
Even in the largest arteries, attenuation is predicted to be measurable. Fig. 12.36 (b) shows that the predicted attenuation per wavelength decreases with increasing a (i.e. with increasing frequency* [*For large values of a (greater than about 6), the value of k shown in Fig. 12.36 (b) is approximately given by the equation
k = p21/2/a (12.27)
The corresponding value of the wave-speed is
c = c0 (l - l/a21/2)
where c0 is the Moens-Korteweg wave-speed.]
However, the attenuation per unit distance increases with increasing frequency, because the wavelength l decreases. The quantity k/l (see Equation (12.26)) is proportional to w1/2, so the higher frequency components die out more rapidly in a given length of tube.The amount of attenuation in a given length of artery can readily be predicted from Fig. 12.36 (b) (or Equation (12.27)). In a dog's aorta, the fundamental wave has a frequency of about 2 Hz (w = 4p) with an associated value of a of about 11. The corresponding value of k is seen to be about 0.4, and the wave is thus predicted to be attenuated by 33 per cent per wavelength. Since the wavelength is about 3 m, this means attenuation by only 5 per cent in the length of the aorta. The value of k for a wave of frequency 40 Hz is about 0.1 and that for a wave of frequency 100 Hz is 0.06. Waves of these frequencies would thus be attenuated by 24 per cent and 33 per cent respectively in the length of the (dog's) aorta. Now in the experiments already mentioned, in which artificial high-frequency oscillations of between 40 Hz and 150 Hz were superimposed on the pulse-wave in a dog's aorta, the attenuation was very carefully measured, and was found to be much greater than predicted. The results of the experiments were that k showed no significant variation with frequency, and that its value almost always lay in the range 0.7 to 1.0.
These results are consistent with other measurements made at much lower frequencies, and shown in Fig. 12.37.
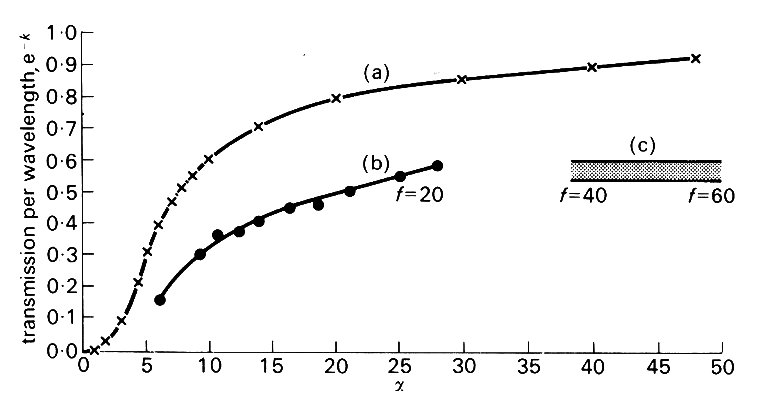
Fig. 12.37. The attenuation factor e plotted against a for pressure waves in the dog's aorta, (a) values predicted on the assumption that all attenuation is caused by blood viscosity, (b) and (c): measured values in two series of experiments. f is frequency in Hz. (From McDonald (1974). Blood flow in arteries. Edward Arnold, London.)
In its prediction of attenuation, therefore, the viscous theory is inadequate, especially for high-frequency waves. The additional attenuation must be associated with dissipative mechanisms in the vessel wall, through the visco-elasticity either of the materials comprising the wall or of the tissue to which the wall is tethered (see §7.2). Before turning to this topic, we should remark that the experiments on high frequency waves in vivo showed that attenuation was significantly greater for waves travelling upstream against the mean flow (k = 1.3 - 1. 5) than for those travelling with the mean flow (k = 0.7 - 1.0). The probable reason for that is the variation in wave amplitude which results from the tapering and stiffening of the aorta with distance (see §12.4.7). This would have the effect of reducing the attenuation for downstream waves and enhancing it for upstream waves.
12.6.3 Effect of wall visco-elasticity. The introduction of visco-elastic, rather than purely elastic, vessel wall properties alters the relationship between excess pressure and cross-sectional area, as explained in Chapter 7 (§7.2). If the applied stress oscillates with amplitude S and frequency w, the resulting strain has amplitude S/(Edyn2 + h2w2)1/2, and exhibits a phase lag of approximately hw/Edyn, where Edyn is the dynamic Young's modulus (greater than a statically measured value of E), and h is the viscous term.* [*Using complex numbers, this can be expressed by replacing the Young's modulus E (Equation (7.1)) by Edyn+ ihw. In the same way, D (Equation (7.3b)) is replaced (approximately) by DE(Edyn- ihw)/(Edyn+ ihw).]
Correspondingly, the distensibility D (Equation (7.3b)) decreases by a factor E/(Edyn2 + h2w2)1/2, and the area changes lag the pressure changes by the same phase lag hw/Edyn. The result is a slight increase in wave-speed (contrasting with the decrease from blood viscosity) consequent upon the decrease in distensibility, and, again, an attenuation of the wave as it propagates. The amount of attenuation per wavelength can again be represented by a constant k (cf. Equation (12.26)), which is approximately equal to 2p times the phase lag hw/Edyn in radians, as long as that is small. But, as described in Chapter 7, hw/Edyn is approximately constant for frequencies above 5 Hz and takes a value between 0.1 and 0.2. Thus k should take a value between about 0.6 and 1.2, and indeed that is what is observed in the experiments already described (Fig. 12.37). It seems, therefore, that the attenuation of high frequency waves is well described by this simple model of wall visco-elasticity. For the lower frequency waves typical of the fundamental and first harmonic (frequency less than 5 Hz), the value of the phase lag, and hence that of k, is smaller. In addition the contribution to attenuation from blood viscosity is larger at low frequencies, so both effects are of comparable importance for the basic pulse-wave. Since the wavelength of that wave is so long, however, the predicted attenuation (k less than 1) is unlikely to be easy to measure, because of the distortion of the wave-form by reflections, etc.
There are other types of wave which can propagate along arteries in addition to the pressure wave. Suppose that the artery is modelled as a long, thin-walled, untethered elastic tube containing a viscous fluid, and that the mathematical analysis is carried out on the reasonable assumptions that (a) only axial and radial fluid motions are present, and (b) that the wavelengths of all waves are very long compared with the tube radius. Then the calculations result in two possible values for the wave-speed c, with corresponding values of the attenuation factor e-k (based on the inviscid wave-speed c0). One pair of values, c1 and e-k1, corresponds to the pressure wave, and the dependence of these quantities on a is shown in Fig. 12.36. The other pair of values, c2 and e-k2, are also plotted in Fig. 12.36.
These correspond to a different type of wave, often called the fast wave because c2 is greater than c1 for all values of a, and becomes infinitely large for infinitely large values of a. Whereas the pressure wave is associated primarily with radial motions of the vessel wall, this second type of wave is associated chiefly with longitudinal motions. Elements of the tube wall oscillate longitudinally backwards and forwards, under the action of a restoring force depending on the longitudinal stretch of the wall. The inertia required to counteract the restoring force is provided by the fluid which is dragged backwards and forwards with the wall through the shearing action of viscosity. For large values of a, the amount of fluid set in motion in this way is confined to a thin boundary layer, and the bulk of the fluid remains at rest. As a increases, the boundary layer becomes even thinner, and the inertia of the fluid diminishes. Therefore the wave-speed increases, which explains the large a result in Fig. 12.36 (a). In a real tube, of course, the inertia of the tube wall itself would provide a limiting value above which c2 could not rise.
At first glance it is surprising that when a is very small this type of wave has a non-zero wave-speed, and negligible attenuation. It can be understood when we realize that, in this limit, the longitudinal oscillations of a segment of wall cause all the fluid contained in that segment to be carried backwards and forwards as a solid body. The fluid motion is everywhere in phase with the wall motion, and there is no shearing at all. Therefore no energy is dissipated in the fluid, and the wave is not damped.
Yet a third type of wave is possible if there are torsional or twisting oscillations of the tube wall which, through viscous action, drive circumferential shearing motions of the fluid. These provide the inertia to balance the elastic restoring force. Since torsional waves have not been observed, we consider them no further.
In fact, the fast shear waves are not observed in vivo either. The reason for this almost certainly lies in the tethering of artery walls to the surrounding tissue. This tethering inhibits longitudinal (and torsional) wall motions almost entirely, while it still permits significant radial motions to take place. It can be analyzed by considering the artery wall to be fastened to a rigid support by springs with certain elastic and viscous properties. Even when these properties are chosen to be much weaker than is actually the case, the calculations show that shear waves are almost totally suppressed.
Tethering of the wall is only one of many different modifications of the simple artery model which research workers have analysed in order to assess their importance. They have, for example, considered the effect of the inertia of the wall itself, which puts a limit on the maximum wave-speed of shear waves, and in addition increases the inertia component of the fundamental pressure waves, and hence reduces the wave-speed slightly. They have also examined many different models of wall elasticity other than that of the thin-walled tube of uniform Young's modulus E, including the effects of a thick wall, with anisotropic elastic properties, and subject to different initial st.esses, as well as the effect of visco-elasticity. All these factors, however, influence only the relationship between tube distensibility and the elastic properties of the wall. They do not affect the relationship of wave-speed to distensibility (Equation (12.9)), except in so far as dissipative forces introduce phase changes and damping, and hence they do not alter the basic mechanics of wave propagation.* [*These various modifications of the simple elastic artery model are reviewed in detail by R. H. Cox (1969), 'Comparison of linearized wave propagation models for arterial blood flow analysis', Journal of Biomechanics, 1, 251-65.] Finally, mention must be made of the one other type of wave which can exist in arteries: a true sound wave. In such a wave, the restoring force comes from the compressibility of the fluid (or solid) in which it is being propagated, and not from the distensibility of vessel walls. Such waves certainly are propagated in blood vessels and other tissues of the body, but since their speed of propagation is very large (about 1500 m s-1), their passage through the cardiovascular system is virtually instantaneous, and their overall dynamic effect is negligible. The neglect of sound waves is equivalent to the assumption, made throughout this book, that blood is an incompressible fluid. The physical nature of the heart sounds is dealt with in Chapter 11.