
We saw in the last chapter that in the large arteries blood may be treated as a homogeneous fluid and its particulate structure ignored. Furthermore fluid inertia is a dominant feature of the flow in the larger vessels since the Reynolds numbers are large. The fluid mechanical reasons for treating the circulation in two separate parts, with a division at vessels of 100 mm diameter, were also given in that chapter. In the microcirculation, which comprises the smallest arteries and veins, and the capillaries, conditions are very different from those in large arteries and it is appropriate to consider the flow properties within them separately.
First, it is no longer possible to think of the blood as a homogeneous fluid; it is essential to treat it as a suspension of red cells and other formed elements in plasma. As will be seen later in the chapter, this comes about because even the largest vessels of the microcirculation are only approximately 15 red cells in diameter. Secondly, in all vessels, viscous rather than inertial effects dominate and the Reynolds numbers are very low; typical Reynolds numbers in 100 mm arteries are about 0.5 and in a 10mm capillary, they fall to less than 0.005 (see Table I).
In larger arteries, the Womersley parameter a (§5.6) is always considerably greater than unity. In the microcirculation, however, a is very small; in the dog (assuming a heart rate of 2 Hz) it is approximately 0.08 in 100 mm vessels and falls to approximately 0.005 in capillaries. This means that everywhere in these small vessels the flow is in phase with the local pressure gradient and conditions are quasi-steady. The pressure and flow may, as we shall see later (§13.4.1), still be pulsatile, but the flow pattern at all points and all times will be determined solely by the balance between pressure and viscous forces. Inertial forces, which are those associated with both local and convective accelerations, are negligible (see Equation (4.5), §4.4). Another important consequence of the small diameter of microcirculatory vessels is that despite the low blood velocity and Reynolds numbers, the wall shear-rates tend to be considerably higher (of the order of 1000 s-1) than in large vessels. This has a significant effect on blood flow as discussed later.
In addition to the fluid mechanical arguments there are physiological reasons for distinguishing two regions of the circulation. The large vessels provide a supply and drainage system for the microcirculation, which is where most mass transport between blood and tissue occurs.
Little work on the mechanical properties of the microcirculation has been done in the dog; our understanding is based largely on studies of smaller laboratory animals such as the rat, rabbit, and frog. The fact that studies must almost always be performed by microscopy has limited them mainly to flat, almost two-dimensional vascular beds, such as those in the mesentery and amentum (thin transparent tissues supplying the gut), the cremaster muscle (a superficial sheet of muscle in the scrotal wall), the tenuissimus muscle (in the leg) and the hamster cheek pouch. The bed of the bat wing has also been used and is of particular interest because, unlike the other preparations, it can be studied without anaesthesia. Three-dimensional beds such as those in skeletal muscle have not yet been studied nearly as extensively, even though considerable effort has been made to develop the necessary experimental techniques.
Direct measurement of microcirculatory flow conditions is extremely difficult for reasons other than simply the small scale at which studies are performed. The vessels are highly reactive to any mechanical stimulus; thus the surgical procedure, the introduction of pressure-measuring needles, and the effects of maintaining tissues on a microscope stage are all potential causes of artefact. Such difficulties have led many workers to study models of the microcirculation rather than handle physiological preparations.
Although our knowledge of the microcirculation is built up from such fragmented sources, the mechanical properties and dimensions of vessels, in particular beds of the various mammalian species, do not show marked differences. It is reasonable at present to base a description of a typical microcirculation on the information available from them.
A schematic representation of a microcirculatory bed, based on observations in the mesentery, is shown in Fig. 13.1.
Fig. 13.1. Diagram of the niicrocirculatory unit. In this illustration the metarteriole does not terminate by dividing into capillaries but continues until it joins the venule as a thoroughfare channel. (From Friedman (1971). 'Microcirculation'. In Physiology (ed. Selkurt), Chapter 12, p. 260. Churchill Livingstone, Edinburgh and London.)
Comparison of the numerical data for different beds is extremely difficult because different investigators used different criteria for subdividing the micro vasculature. Nevertheless, recent data on various commonly studied microcirculatory beds are presented in Table 13.1 and Table 12.2.
Table 13.1. Summary of available data on vessel dimensions and flow-rates in the microcirculatory vessels of various species. Figures for the bat wing relate to the whole bed, data for the mesentery include the amentum in some cases |
||||||
| Property | Arteriole | Capillary | Venule | |||
| Large | Small | Artery end | Vein end | Small | Large | |
| Diameter (mm) | ||||||
| Bat wing | 19 | 7 | 3.7 | 7.3 | 21 | 37 |
| Cat mesentery | 70 | 20 | 10 | 20 | 70 | |
| Rat cremaster muscle | 80 | 14 | 5.5 | 6.1 | 24 | 74 |
| Cat tenuissimus muscle | 22 | 10 | 4.7 | 5.9 | 10 | 40 |
| Length | ||||||
| Bat wing | 3500 | 950 | 450 | 1000 | ||
| Cat mesentery | 380 | 200 | 130 | 130 | 350 | |
| Rat cremaster muscle | 615 | 300 | ||||
| Cat tenuissimus muscle | 300 | 100 | 1000 | 100 | ||
| Number | ||||||
| Bat wing | 12 | 120 | 1700 | 350 | 25 | |
| Cat mesentery | 2 | 9 | 20 | 10 | 2 | |
| Velocity (mm s-1) | ||||||
| Cat mesentery | 1.0 - 31.7 | 0 - 1.7 | 0.5 - 11.1 | |||
| Rat cremaster muscle | 0.8 - 12.9 | 0.2 - 1.2 | 0.4 - 6.6 | |||
| Cat tenuissimus muscle | 0 - 1.5 | |||||
| Data derived mainly from the
following sources:
Schlechta and Fulton (1963). 'Blood flow-rates in
small vessels of the hamster cheek pouch'. Proc. Soc. exp. Biol. Med.
112, 1076. Smaje, Zweifach, and Intaglietta (1970). 'Micropressures and capillary nitration coefficients in single vessels of the cremaster muscle of the rat'. Microvasc. Res. 2, 96-110. Gaehtgens, Meiselman, and Wayland (1970). 'Erythrocyte flow velocities in mesenteric microvessels of the cat'. Microvasc. Res. 2, 151-62. Intaglietta, Tompkins, and Richardson (1970). 'Velocity measurements in the microvasculature of the cat omentum by on-line methods', Microvasc. Res. 2, 462. Erikson and Myrhage (1970). 'Microvascular dimensions and blood flow in skeletal muscle' Acta Physiol. Scand. 86, 211-22. Wiedeman (1963). 'Dimensions of blood vessels from distributing artery to collecting vein'. Circulation Res. 12, 375-8. |
||||||
13.1.1 The arteriolar system. As can be seen from Fig. 13.1 the arterioles divide first into metarterioles before the capillary network itself is reached. The separate existence of metarterioles is not acknowledged by some authors, who characterize them simply as the smallest terminal arterioles. This lack of distinction is easy to appreciate as it is often difficult, at a bifurcation where two daughter vessels are similar in size, to distinguish between the vessels. Furthermore there is a continuous distribution of vessel sizes and thus the distinction between various categories of vessel is rather arbitrary. In the model shown the metarterioles are lateral branches off a feeding arteriole, and a single arteriole will thus be capable of providing a number of metarterioles along its length; it also thus generates a number of capillary systems which can operate in parallel along its path. The angle at which metarterioles branch off the parent arteriole strongly depends upon the particular vascular bed. In many mesenteric preparations they have been found to branch off at 30-60° from the axis of the parent arteriole, while in skeletal muscle they frequently arise at right angles.
The diameter of the largest arteriole is in the region of 50-100 mm; by progressive bifurcation it is decreased until at the level of the origin of the metarterioles it is about 30 mm. Metarterioles at their origin are in the region of 20 mm in diameter and occur at something like 600 mm intervals along the arteriole. It has been calculated that in the tenuissimus muscle of the cat the typical distance from larger arteriole to the capillary network is 1-2 mm. As the diameter decreases, so does vessel wall thickness. The largest vessels, with diameters in the region of 100 mm, have a wall thickness of about 20 mm whereas the smallest arterioles, 20 mm in diameter, have a wall thickness of approximately 6 mm. Thus the ratio of vessel wall thickness to diameter increases from around 0.2 to 0.3 as the calibre decreases over this range.
13.1.2 The capillary system. The branching pattern observed in the capillary system varies considerably not only from tissue to tissue but also within any one bed; again Fig. 13.1 gives some idea of the organization. The smooth muscle in the wall of the metarteriole (see §13.2.1) becomes progressively sparse along its length until the vessel branches into a number of true capillaries, some of which have precapillary sphincters at their origins. At this level the metarteriole may either disappear or continue as a somewhat enlarged capillary-like structure without smooth muscle—the thoroughfare or preferential channel.
The pre-capillary sphincter consists of one or two smooth muscle cells, wrapped around the arteriolar-capillary junction. The internal diameter of the sphincter when relaxed is the same as that of the capillary itself. Such sphincters are not observed in all microvascular beds, nor are they present at the entrance to every capillary in beds where they have been observed. They have been shown to exist in the frog tongue and mesentery, but have not been demonstrated in skeletal muscle. It has been suggested that in some beds, sphincter-like activity may reside in the perivascular muscle of the smallest arterioles (see §13.2.1).
The question of whether or not thoroughfare channels exist has generated much interest because, functioning in association with the precapillary sphincters, they are capable of markedly controlling the blood flow and transcapillary exchange within a unit. Thus if all the precapillary sphincters were to constrict, perfusion should be shunted predominantly to the low resistance pathway of the thoroughfare channel and the unit effectively by-passed. This proposed mechanism of by-passing a unit is somewhat different from the older one that arterial to venous anastomoses are responsible for perfusion shunts; such anastomoses would have a wall structure similar to small arterioles and venules, containing some smooth muscle. However, such shunts have been identified only in a few microcirculations, namely the cutaneous circulation and the submucosa of the stomach. In general there are numerous artery-to-artery and vein-to-vein anastomoses which permit effective shunting between units, but give no degree of control within a unit. Examples of these can be seen in Fig. 13.20.
In many beds the capillary network is tortuous, with multiple cross connections; the arrangement can be seen in Fig. 13.20. However, in skeletal muscle the arrangement is far more uniform. Fig. 13.2 shows the organization of the capillary system in the rat cremaster muscle.
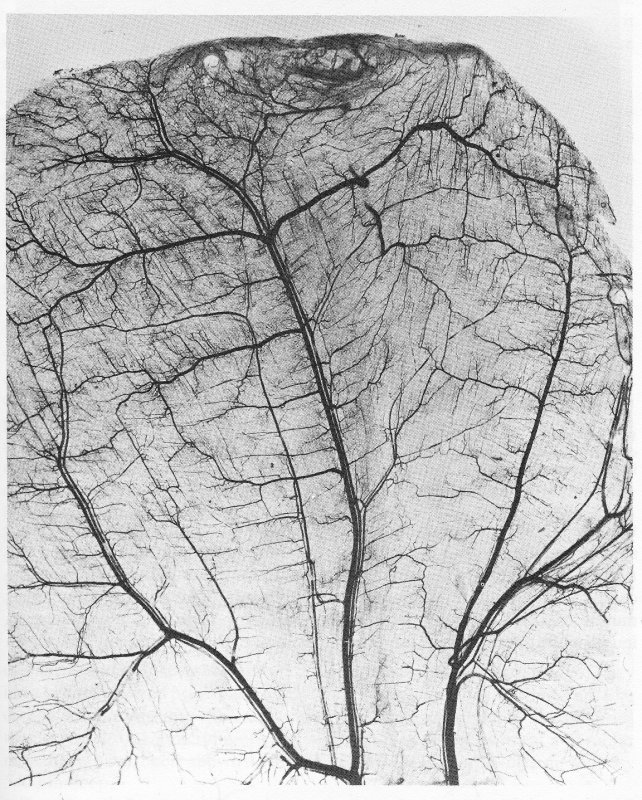
Fig. 13.2. Photomicrograph of rat cremaster muscle after intravenous injection of carbon to visualize the vascular pattern. The main arteries and veins can be seen running parallel to one another (veins larger). Muscle fibres are arranged in two layers approximately at right angles to one another, with capillaries running parallel to the fibres. (From Smaje, Zweifach, and Intaglietta (1970). 'Micropressures and capillary filtration coefficients in single vessels of the cremaster muscle of the rat'. Microvasc. Res. 2, 99.)
The small arteries and veins run parallel to each other, the arterioles branch off at right angles, and the capillary networks are arranged so that the capillaries run parallel to the muscle fibres. Fig. 13.2 illustrates two layers of capillaries running parallel to the layers of muscle fibres which lie approximately at right angles to each other. That the capillaries in skeletal muscle run parallel to the muscle fibres can be seen very clearly in Fig. 13.3, in which the majority of fibres are at right angles to the plane of the paper and the capillaries can be seen to be parallel to the fibres.
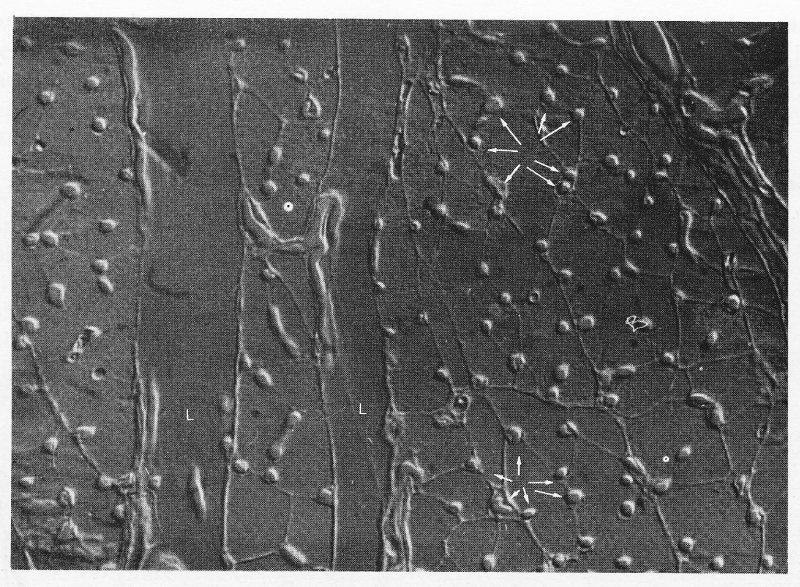
Fig. 13.3. Interference photomicrograph of a cross-section through skeletal muscle. The dense capillary network surrounding the muscle fibres can be seen (arrowed). Muscles are visible in longitudinal section (L) at the left of the photograph, as are parts of associated capillaries. (Reproduced by courtesy of Dr. G. Gabella, University College, London.)
The organization of the capillaries in the rat cremaster muscle is schematically illustrated in Fig. 13.4. It will be specially noted that the capillaries are greater in diameter at the venular end than at the arterial end, but always less than the nominal red cell diameter. It is now widely accepted that capillaries are smaller in diameter than the red cells which have to pass through them and also that the arterial end of the capillary is the narrowest part of the circulation, the capillary increasing in diameter along its length. Thus the cat tenuissimus muscle capillary increases from approximately 4.7 mm to 5.9 mm along its length while the cat red cell is 6.0 mm in diameter.
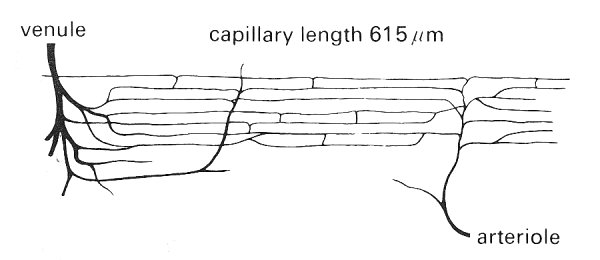
Fig. 13.4. Idealized diagram of the capillary network in the rat cremaster muscle. Capillary diameter at arteriolar end: 5.5 mm; Capillary diameter at venular end: 6.1 mm; Distance between capillaries: 34 mm; Distance between cross-connections between capillaries: 210 mm; capillary density: 1300 mm-2 ; Capillary surface area: 244 cm2 per cm3 muscle; average rat red cell diameter: 7.5 mm. (From Smaje, Zweifach, and Intaglietta (1970). 'Micropressures and capillary nitration coefficients in single vessels of the cremaster muscle of the rat'. Microvasc. Res. 2, 105.)
The bat wing capillary has an average internal diameter of 3.7 mm whilst the bat red cell diameter is 6.4 mm. The capillary length in rat cremaster muscle is approximately 600 mm whilst it is approximately 1000 mm in the cat tenuissimus muscle. In both muscles there are numerous intercapillary cross connections occurring about every 200 mm.
13.1.3 The venular system. At their downstream end the capillaries merge, usually in pairs to form first the postcapillary and then the collecting venules. These then progressively merge to form the larger venules and ultimately the veins. This pattern of dichotomous convergence, whilst very common, is not universal; in the tenuissimus muscle for instance there tends to be a single large venule with smaller ones joining it at frequent intervals. Fig. 13.1 implies that all capillaries originating from one arteriole converge into a single venule; however, this is not necessarily the case, particularly in three-dimensional beds. The dimensions of venules in various beds are given in Table 13.1.
13.1.4 The lymphatic system. In addition to the blood circulation, there exists a separate but related system, the lymphatic circulation, whose function is to drain the interstitial space (see §13.2.5). As explained later (§13.7.1) fluid passes out of the capillaries at the arterial end of the capillary system and is then partially re-absorbed at the venular end. The excess fluid which is not re-absorbed passes into the lymphatic capillaries. These are thin-walled, blind-ended sacs distributed throughout the interstitial space especially around the collecting venules. The lymphatic capillaries join together to form collecting lymphatics and these in turn merge to form larger lymphatic vessels which run beside the venules and veins. From these are formed main lymphatic trunks which largely drain via the thoracic duct into the subclavian vein in the neck, thereby returning the lymph to the systemic circulation. There are abundant valves throughout the lymphatic system (in all vessels but the capillaries) directed so that flow can occur only towards the thoracic duct.
Only scant information is available on the distribution of the lymphatic capillaries and collecting vessels, since they are difficult to observe in vivo. They have been visualized principally by injecting dyes and particulate materials like carbon suspensions into the interstitial space, or into the lymphatic capillaries themselves through micropipettes. The lymphatic capillaries in cat and rabbit mesentery have been shown to be flattened sacs some 40-60 mm wide by 5-6 mm deep.
Total lymph flow-rates depend strongly upon the level of exercise, food and fluid intakes and many other factors, but in the normal adult man are in the region of 150 cm3 h-1.
The overall composition of the three main types of microcirculatory vessel is given in Table 13.2.
Table 13.2 Approximate composition of blood vessels (per cent) |
|||
|
Vessel type |
|||
| Arteriole | Capillary | Venule | |
|---|---|---|---|
| Endothelium | 10 | 100 | 20 |
| Elastic tissue | 10 | ||
| Muscle | 60 | 20 | |
| Connective tissue | 20 | 60 | |
These figures are approximate since the proportion of each constituent varies with vessel size; the table gives no indication of the organization of the various components. To obtain this we must consider each vessel type separately. All vessel walls are composite in structure and cannot be considered to be isotropic. In all vessels, the innermost cellular lining is a layer of endothelial cells, and in all vessels except capillaries, smooth muscle cells can be identified. It has recently been demonstrated by use of special staining techniques that there is a lining material present on the luminal surface of the endothelium. It appears to be a very thin layer (approximately 5-10 nm thick) of a mucopolysaccharide complex, and it is this substance rather than the endothelium which forms the real luminal surface in all blood vessels throughout the circulation.
13.2.1 The arterioles. The arterioles can be regarded as very small arteries, and have a wall structure similar to that of the artery described in Chapter 12, though they have no vasa vasorum. The layered wall structure is similar in all arterioles but there are progressive changes in the relative proportions of the components as vessel size decreases. Fig. 13.5 shows a transmission electron micrograph of a transverse section of an arteriole, in which the three principal concentric layers of tissue are seen, just as in an artery.
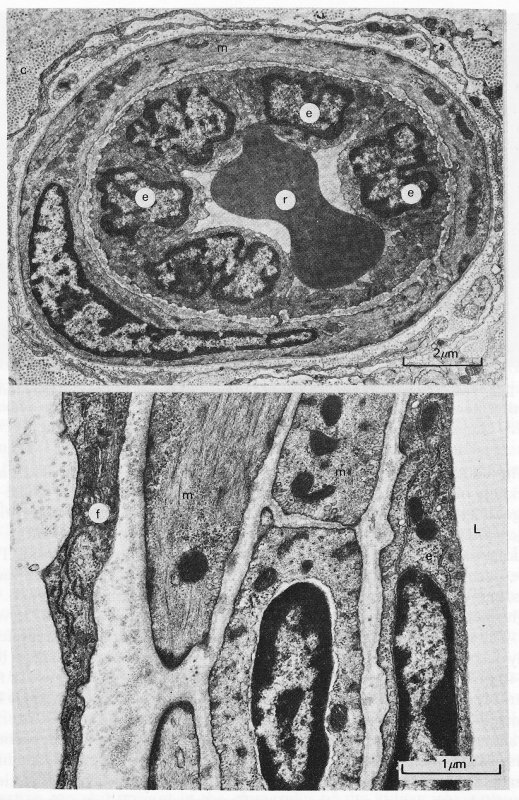
Fig. 13.5. The upper panel shows an electron micrograph of an arteriole in the rat oesophagus. A single smooth muscle cell fully encircles the endothelium. (c: collagen fibrils; e: endothelial cell; m: smooth muscle cell; r: red blood cell.) The lower panel shows an electron micrograph of a section of an arteriole in the rat heart. Two layers of smooth muscle cells can be seen. (e: endothelial cell (intima); f: fibroblast (adventitia); L: lumen; m: smooth muscle cells (media).) (Reproduced by courtesy of Dr. G. Gabella, University College, London.)
The intima contains endothelial cells, a basement membrane and some connective tissue. The endothelial cells are arranged in a single layer and are close together (Fig. 13.6), separated by narrow intercell clefts running from the luminal surface through towards the basement membrane. Near the luminal end of the intercell cleft, adjoining cells form a close contact or junction. In arterioles, this junction is said to be 'tight', as explained later (§13.2.5). The endothelial cell layer appears to be attached directly to the basement membrane under normal physiological conditions but can become separated by mechanical stress or under circumstances of excessive protein leakage from the plasma. The basement membrane appears to be a mesh of collagen though its precise form and mechanical properties have yet to be established. If the luminal surface is examined in a preparation fixed under unstretched conditions, it has a highly convoluted form; but when fixed at physiological pressures the surface appears smooth.
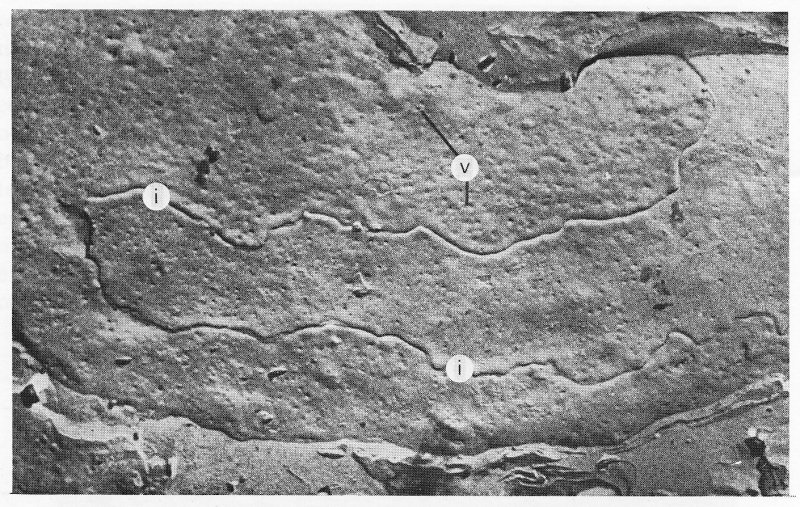
Fig. 13.6. Freeze-fracture electron micrograph of endothelial cells in heart capillary. Intercell junctions (i) and surface invaginations (v) formed by vesicles opening onto the surface can be seen. (From Leak (1971). 'Frozen-fractured images of blood capillaries in heart tissue'. J. ultrastruct Res. 35, 127-46.)
The endothelial cells of arterioles of all sizes appear similar and have a thickness of about 0.1-0.3 mm except in the region of a nucleus where they bulge to 2-4 mm. All the cells contain vesicles, the structural characteristics of which are discussed later (§13.2.6); their function is considered in §13.7.10. Endothelial cells also contain microfilaments within their cytoplasm. These have been shown to contain contractile proteins, similar to those in muscle cells, and there is a possibility that they may have a contractile function.
The media of the arterioles shows considerable variation according to vessel size. The smooth muscle cells in this part of the wall are arranged circumferentially or spirally; as in arteries, individual muscle cells are spindle-shaped, being 30-40 mm long by 5 mm wide. In the larger arterioles (50-100 mm) two or three layers of smooth muscle can be observed, but these are reduced to a single layer in vessels less than approximately 50 mm in diameter. In even smaller arterioles the amount of smooth muscle in the single layer is further reduced, becoming sparse in the metarterioles. The medial smooth muscle layer may extend to form a ring around the origin of the capillaries, and when this is clearly identifiable it is described as the precapillary sphincter. Collagen fibres tend to be arranged longitudinally among the muscle cells, the number of fibres decreasing with the amount of smooth muscle.
In arterioles larger than 30 mm the basement membrane separates the endothelial and muscle cells, but in smaller vessels the muscle cells often form a tight junction with endothelial cells through gaps in the membrane. This phenomenon is observed with increasing frequency as vessel size is decreased. Small nerve fibres can be seen running parallel to the arterioles and they make occasional junctions with the smooth muscle cells of the media; these are most common in the smallest arterioles.
The adventitia consists mainly of collagen fibres with a few elastic fibres interspersed in a loose matrix. The outer limit of this layer is hard to identify as the vessel wall progressively merges with the loose connective tissue of the interstitial space.
13.2.2 The capillaries. As the terminal arterioles divide into the capillary system and thoroughfare channels, the structure of the wall changes considerably. The capillary wall consists simply of a single layer of endothelial cells surrounded by its basement membrane which splits to enclose occasional cells called pericytes (Figs. 13.7 and 13.8). These are thought to have the potentiality to become smooth muscle cells.
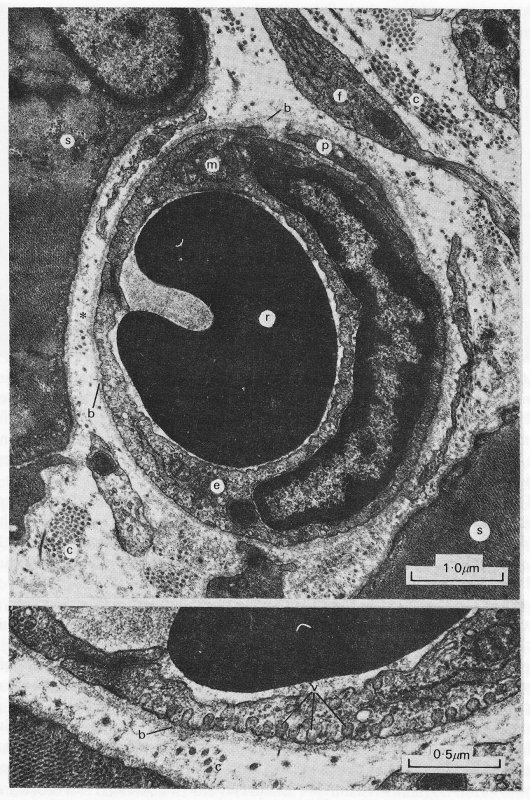
Fig. 13.7. The upper panel is a transmission electron micrograph of a capillary in the rat oesophagus and surrounding striated muscle. The lower panel shows a further magnified view of the wall in the vicinity of the asterisk, (b: basement membrane; c: collagen fibrils; e: endothelial cell with nucleus; f: fibroblast; m: mitochondria; p: pericyte; r: red blood cell; s: striated muscle fibre; v: pinocytic vesicles.) (Reproduced by courtesy of Dr. G. Gabella, University College, London.)
The endothelial cells of the capillary wall are arranged with their edges closely opposed to one another and with a variable degree of overlap (Figs. 13.6 and 13.7). There are usually either one or two endothelial cells encircling a capillary at any cross section. Vesicles are again abundant in the endothelial cells. An idea of the three-dimensional structure of a capillary can be gained from Fig. 13.8. The endothelial lining and overlap between cells can be seen, as can the close association of the basement membrane including the manner in which it splits to surround the pericyte.

Fig. 13.8. The three-dimensional architecture of the heart muscle capillary with its luminal content of red blood cells (RBC) and wall of endothelium (E), basement membrane (bl), and pericyte (P) is illustrated. This diagram was constructed from three-dimensional relief images obtained from replicas of heart capillaries of both fixed and unfixed frozen etched preparations. Both luminal and connective tissue surfaces of the endothelium are populated by vesicles. The topographical association between opposing cell margins to form intercellular junctions (j) is depicted in both surface and cross views. The basement membrane (bl) is continuous over the endothelial surface as well as the adjacent pericyte (P). (From Leak (1971). 'Frozen-fractured images of blood capillaries in heart tissue'. J. ultrastruct. Res. 35, 127-46.)
The appearance of the endothelial cell lining of capillaries depends upon which microcirculation is under study. Three major types are distinguished, based upon the continuity of the endothelium; they are shown in Fig. 13.9. In continuous endothelium, the endothelial cells are usually tightly joined with a considerable length of contact between them (Fig. 13.7). In the vessels of striated muscle, the cells may be quite flat with a thin periphery; in others such as the postcapillary venules they may be cuboidal and form a thick layer.

Fig. 13.9. Classification of capillary vessels according to the continuity of the endothelium. Three main types are distinguished (continuous, fenestrated, discontinuous) and, for each, two main varieties are represented. Little detail is shown because there are considerable variations from organ to organ; in fact almost every organ can be said to have its own type of capillary vessels. The scheme is based on information derived mainly from mammals, (a), (b) The endothelium has no recognizable openings. The low variety (a) is found in striated muscle, myocardium, central nervous system, smooth muscle of digestive and reproductive systems, and sub-cutaneous and adipose tissue. The high variety (b) is typical of the postcapillary venules of the lymph nodes and thymus; a similar endothelium is found also in the large arteries when contracted, (c), (d) The endothelium has intracellular fenestrae (arrows), either closed (c) as in endocrine glands, choroid plexus, ciliary body and intestinal villus, or open (d) as in the renal glomerulus. (e), (f) The endothelium has intercellular gaps. These vessels are also referred to as 'sinusoids'. They are typical of liver, bone marrow, and spleen; in each of these sites they differ in structural detail. (From Majno (1965). 'Ultrastructure of the vascular membrane'. In Handbook of physiology. Section 3: Circulation, vol. II. American Physiological Society, Washington D.C.)
In fenestrated endothelium the cell is so thin that the opposite surfaces of its membrane are very close together and form small circular areas known as diaphragms orfenestrae approximately 25 nm thick and of the order of 0.1 mm across. Adjacent endothelial cells are still usually tightly joined. Such endothelium has been found in the wall of the small intestine of the guinea pig (Fig. 13.10), the choroid plexus of the brain, and the ciliary body of the eye. Fenestrae are also present in the glomerulus of the kidney where they are thought to be open.
Yet a third type of endothelium is the discontinuous form in which there are distinct intercellular gaps. These occur in the liver, the spleen, and bone marrow. In such cases the basement membrane is also discontinuous.
13.2.3 The venules. The postcapillary venules, although larger than the capillaries supplying them, have virtually the same structure, the only significant difference being the presence of an almost complete layer of pericytes around the endothelium (Fig. 13.11). In collecting venules of diameter 30-50 mm there is a complete layer of pericytes among which can be seen cells regarded as primitive smooth muscle cells. An outer layer of fibroblasts may also be observed in venules of this size.
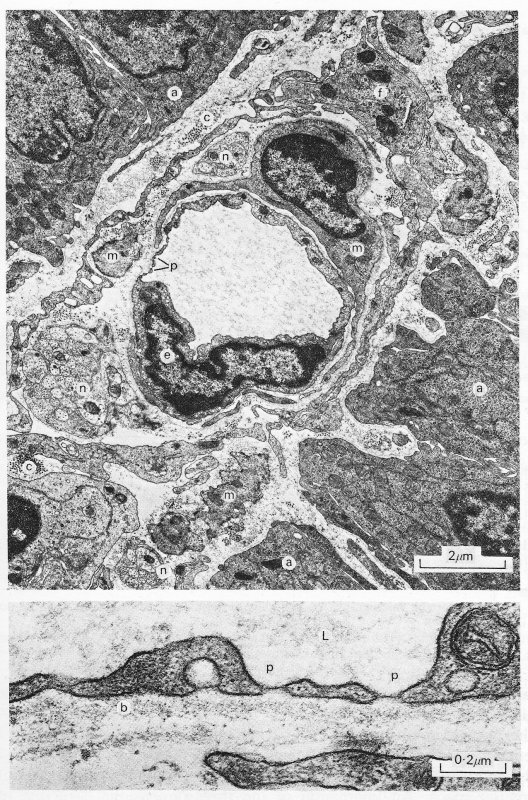
Fig. 13.10. A transmission electron micrograph of a fenestrated capillary within the mucosa of the guinea-pig ileum (upper panel). The details of the fenestrae can be seen more clearly in the lower panel, (a: epithelial absorptive cells; b: basement membrane; c: collagen fibrils; e: endothelial cell; f: fibroblast; L: lumen; m: smooth muscle cell; n: nerve; p: fenestrations.) (Reproduced by courtesy of Dr. G. Gabella, University College, London.)
In venules 50-100 mm in diameter the endothelium and basement membrane is surrounded by one or two complete layers of muscle cells forming a continuous media. The muscle is wound roughly in the form of a spiral, but is somewhat more irregularly arranged than in an arteriole. The adventitial layer consisting of fibroblasts and collagen becomes increasingly prominent as vessel size increases.
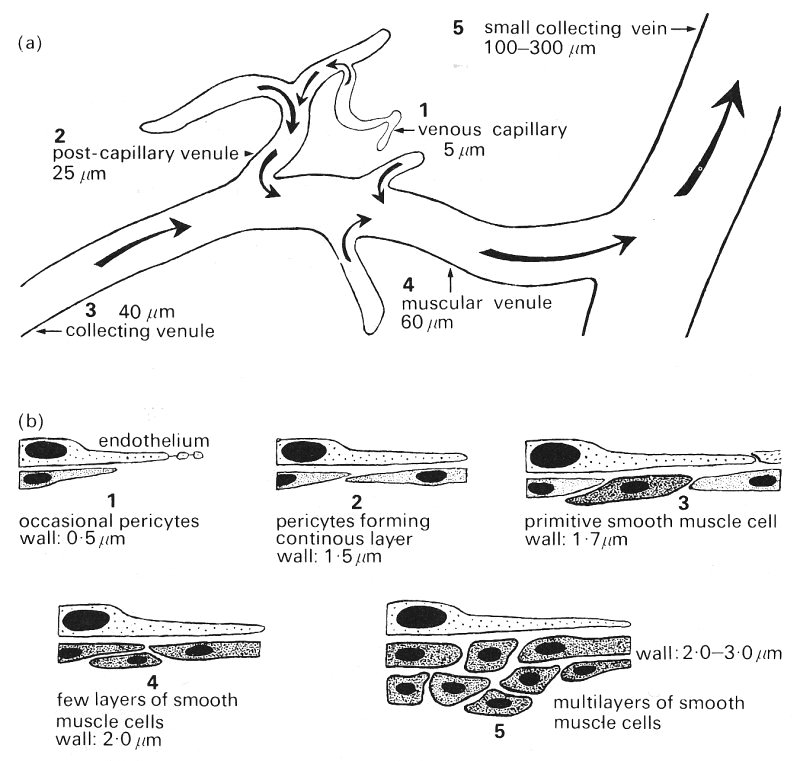
Fig. 13.11. (a) Schematic representation of the venular system indicating location of sections illustrated in (b) and (c).
(b) Schematic representation of the endothelium and underlying cells in the various sizes of venule.

(c) Redrawn electron micrographs of the walls of venules of various sizes showing actual arrangement of cells. (From Rhodin (1968). 'Ultrastructure of mammalian venous capillaries, venules and small collecting veins'. J. ultrastruct. Res. 25, 452-500.)
13.2.4 The lymphatics. In many ways the structure of lymphatic capillaries is similar to that of systemic capillaries. They consist of a single layer of endothelial cells surrounded by a basement membrane and lack smooth muscle in their walls. The endothelial cells also contain vesicles, though their cytoplasm contains more microfilaments than that of the systemic capillary cells. Adjoining endothelial cells overlap by several micrometres but are separated by a distance which varies from zero at occasional points of close contact to about 0.5 mm.
The most striking feature of the lymphatic capillary is the fact that the basement membrane is incomplete and there are filaments running through it to the endothelial cell membrane from the collagen and elastic fibres of the interstitial space. An impression of the three-dimensional structure of a lymphatic capillary is given in Fig. 13.12. It is thought that the anchoring filaments may influence the transport of fluid into the lymphatic capillaries; contraction of the filaments could cause the interendothelial cell clefts to open wider. Alternatively the anchoring filaments would tend to stabilize the wall if the microfilaments within the endothelial cytoplasm were to contract to open up the clefts.
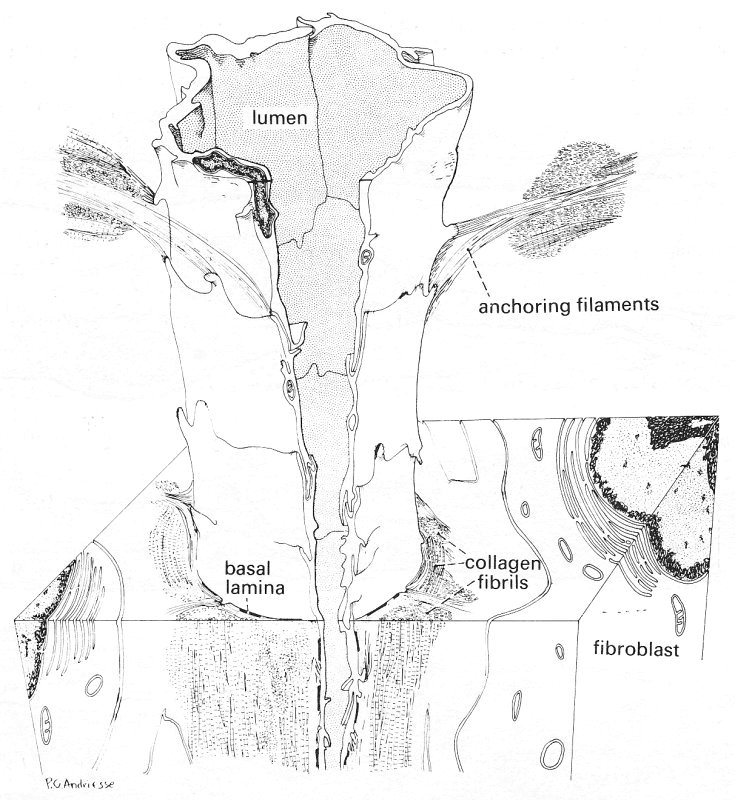
Fig. 13.12. A three-dimensional diagram of a lymphatic capillary, reconstructed from collated electron micrographs. The relationship of the lymphatic capillary to the surrounding interstitial space is illustrated. The anchoring filaments appear to originate from the endothelial cell surface and extend among collagen bundles, elastic fibres, and cells of the adjoining tissue area, providing a firm connection between the lymphatic capillary wall and the surrounding connective tissue. An irregular basement membrane and collagen fibres are marked. (From Leak and Burke (1968). 'Ultrastructure studies on the lymphatic anchoring filaments'. J. Cell Biol. 36, 129-49.)
The collecting lymphatics have a single endothelial cell layer surrounded by a continuous basement membrane. The gap between endothelial cells is virtually eliminated, the cleft being less than 5 nm across. There is a layer of smooth muscle cells surrounding the membrane and bundles of collagen fibres and a few fibroblasts lie outside the muscle layer.
The collecting lymphatics and all larger vessels contain valves consisting of paired leaflets originating from opposite sides of the lymphatic wall. They contain no smooth muscle but the cytoplasm of the individual endothelial cells contains numerous microfilaments which may serve a contractile function.
13.2.5 The junctions between vascular endothelial cells. The nature of the bonding between adjacent endothelial cells deserves consideration because of its relevance to both the mechanical strength and the permeability of the endothelial layer. The gaps between cells are very narrow and our knowledge of the structure and nature of intercellular junctions awaited the introduction of the electron microscope.
The membranes of adjacent cells are mainly parallel and separated by an intercellular space, the intercell cleft, of approximately 15-20 nm. Whilst the contents of the gap are not known with certainty they are thought to consist of mucopolysaccharide. It is also suspected that, because the gap is so uniform in thickness, there is some cohesive force operating between the cells over the entire length of the gap, but whether this is due to the intercellular material or to forces between the membranes is not known. There is in addition a localized site of firmer attachment, the functional complex.
The junctional complex, which consists of a number of specialized structures, is usually positioned near to the luminal surface of adjoining cells, approximately one third of the way along the intercell cleft (Fig. 13.13).
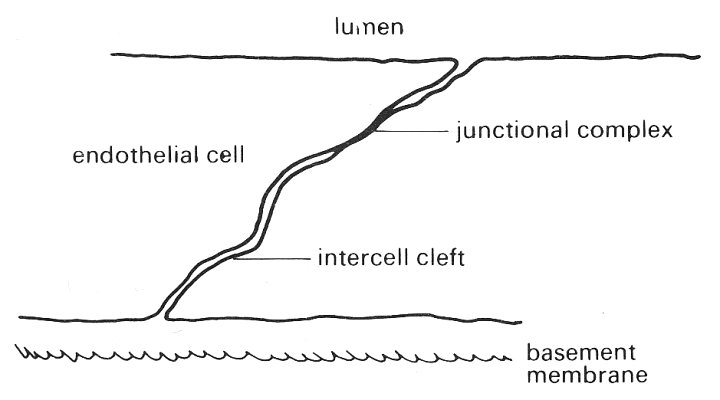
Fig. 13.13. Schematic view of the endothelial layer showing the intercell cleft and junctional complex between adjacent cells viewed in cross-section.
At this site the opposing cell membranes come very close together and an impermeable zone is formed; molecules cannot diffuse past it along the intercell cleft. The complex sometimes forms a continuous band around the side of the cells forming a zonula occludens, and sometimes a discontinuous band, a macula occludens (Fig. 13.14).

Fig. 13.14. Schematic representation of the arrangement of the junctional complex between endothelial cells.
The former continuous junction around the cell effectively provides a tight seal preventing the passage of molecules between the lumen and cell base via the cleft and for this reason is referred to as a tight junction. The discontinuous or 'spot welded' junction, on the other hand, does leave a diffusion pathway available for molecular transport.
In the past it was generally believed that the tight junction exists in all endothelial layers other than in the capillaries, but this view is no longer held with certainty.
13.2.6 The pinocytic vesicles. Reference has already been made to the existence of vesicles in endothelial cells in both the systemic and lymphatic circulations. These are believed to be important in the transport of materials, particularly large molecules, across such cells, by the mechanism known as pinocytosis. This will be discussed later; here we are concerned with a brief description of their structure and distribution. As can be seen in Fig. 13.7, vesicles exist in large numbers both free within the cytoplasm of the cells and attached to the cell membrane; in the latter case they may be open to the exterior of the cell. The material comprising the wall of the vesicle appears to be the same as that of the cell membrane. The free vesicles are roughly spherical and typically 60-80 nm in diameter. Those which are attached to the cell membrane and open on to the surface usually do so through a neck about 25 nm in length and 10-25 nm across. There are approximately 500 vesicles per cell, corresponding to around 25 per cent of the total cytoplasmic volume. There are on average about 120 vesicles attached per mm2 of cell surface.
13.2.7 The interstitial space. The interstitial space is the region which surrounds the blood vessels and cells of all tissues. It contains a complex and as yet poorly understood arrangement of intercellular materials such as collagen and elastin bathed in some kind of fluid. It is suggested that the fluid is an heterogeneous colloidal system (§9.3) of two components in equilibrium with one another. One component tends to be more gel-like than the other, whose properties are more like a dilute sol. The gel phase is highly aggregated, consisting of mucopolysaccharides, particularly hyaluronic acid, and it tends to stay more in contact with the structural elements of the space. The water-rich sol is mobile and contains unaggregated solutes; it is more capable of dissolving and hence transporting water soluble materials within the space. The distribution of the two phases is considered to vary continuously and it is not possible to identify particular sites at which the fluid will have any particular composition.
The static mechanical properties of the vessels in the microcirculation will naturally depend upon their structure and thus it is not surprising that experiments have demonstrated widely ranging mechanical properties. However, because of the size and the highly reactive nature of small vessels, measurements are extremely difficult; our understanding is still very limited and partly based on inference. The elastic properties of both arterioles and venules are explained reasonably well on the basis of the composition of their walls but at present the distensibility of capillaries is not so well understood.
It has already been pointed out in Chapter 7 that arteries exhibit visco-elastic stress-strain properties. This is also true of the vessels of the microcirculation, though because of experimental difficulties little information on the viscoelastic behaviour is available. In this section we shall therefore consider only the elastic behaviour of the small vessels.
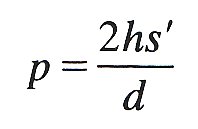
13.3.1 Elastic properties of the arterioles. In Chapter 7 (§7.3) we considered the statics of an elastic tube and showed that the absolute value of the hoop stress in the wall of most blood vessels is compressive rather than tensile; this resulted from the relatively small excess of internal pressure over external pressure and from the fact that the vessel walls are relatively thick. It was also pointed out that we are not normally concerned with the absolute level of stress but rather with changes; thus we are interested to know the change in stress in the wall if the pressure within the vessel is changed by some amount. In order to ascertain the stress required to balance a given distending pressure (relative to atmospheric) we may use the law of Laplace (Equation (7.6)). The amount of extra stress s' in a tube wall of thickness h and internal diameter d produced by a distending pressure p relative to atmospheric is given by
 (13.1)
The product hs' is the total tension in the wall.
We may calculate the total wall tension and stress in a large and small artery to see how they compare; to do so we will consider the canine femoral artery and a 50 mm arteriole. The diameter and wall thickness of the artery are approximately 0.4 cm and 0.04 cm and the average internal pressure is about 1.30 x 10⁴ N m-2 (100 mm Hg). The wall thickness of the arteriole is approximately 20 mm, and thus it is a relatively thick-walled vessel (h/d = 0.4 compared with 0.1 for the artery); the internal pressure is approximately 0.9 x 10⁴ Nm-2 (70 mm Hg).
From Equation (13.1) we can see that the total tension in the wall of the femoral artery is 26 N m-1 compared with 0.22 N m-1 in the arteriole; however, the excess stresses in the walls are much closer (6.5 x 10⁴ N m-2 in the artery compared with 1.1 x 10⁴ N m-2 in the arteriole). The tension in the wall of the arteriole is probably accommodated by the vessel basement membrane and media, which are known to be stronger than the endothelium and adventitia. Thus the stress would be doubled to 2.2 x 10⁴ N m-2 because the membrane and media comprise half the wall thickness. Furthermore, in such a thick-walled tube the stress would not be uniformly distributed throughout the load-bearing part of the wall. In an isotropic elastic tube the stress at the innermost part of the wall would be approximately 20 per cent greater than the average value, that is about 2.7 x 10⁴ N m-2.
Whilst these calculations can give only approximate indications of the hoop stress within the vessel walls, they do indicate the close similarity between conditions in large and small vessels.
The stress-strain relationship of arterioles has been measured in a few instances, though such experiments have proved extremely difficult technically. The curve of cross-sectional area against distending pressure is non-linear and has a similar shape to that obtained from arteries. The arteriole becomes stiffer and the effective Young's modulus increases as the strain increases. Studies on the arterioles of the frog mesentery have indicated that when measured at a diameter of 15 per cent above resting diameter at zero transmural pressure the incremental Young's modulus was 6 x 10⁴ N m-2 rising to 12 x 104 N m-2 at 45 per cent distension. The Young's modulus of collagen is about 10,000 times greater. Such findings would suggest that the collagen in the vessel walls is not taking a significant amount of the load applied. However, this statement ignores the fact that collagen only exhibits its great stiffness when the stress is applied along the axis of the fibre; in a vessel where the fibres are aligned predominantly longitudinally only a small percentage will be experiencing a significant axial stress and hence their contribution to the vessel's elasticity is hard to assess.
The effect of active tension (Chapter 11, §11.3.2) in arteriolar smooth muscle is very important since it is capable of causing marked changes in both the calibre and the stiffness of the vessel. The effects of active tension on the stress-strain properties have recently been studied directly in vivo in the frog mesentery. The arteriole was stretched by various levels of distending pressure and vessel diameter (d) was measured with the smooth muscle relaxed. The vessel was then stimulated to contract maximally with noradrenalin at various levels of initial stretch, and the reduction of diameter (D) was noted. As can be seen from Fig. 13.15, the response of the vessel is extremely dependent upon the initial length. Thus as the distending pressure increases from low to intermediate levels the ability of the arteriole to constrict actively increases markedly, but then at higher initial stress the ability to constrict decreases again. It should be noted that the maximum response of the arterioles occurs at the normal physiological level of applied stress, namely 1.2 x 10⁴ N m-2; thus they are normally close to their optimal diameter and can respond to vasoactive stimulae with calibre changes in the region of 40-50 per cent. The relationship shown in Fig. 13.15 is similar to that found in many other types of muscle including that in the larger muscular arteries.
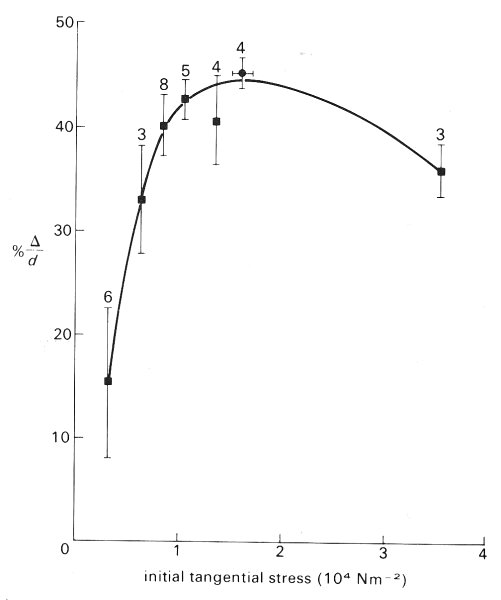
Fig. 13.15. Relation between magnitude of active constriction and initial stress in arterioles of the frog mesentery. This is equivalent to an active length-tension curve for smooth muscle; the behaviour is similar to that of skeletal and heart muscle (Fig. 11.9). The bars on the curve indicate ±1 standard error and the numbers refer to the number of vessels studied. (From Gore (1972). 'Wall stress: a determinant of regional differences in response of frog microvessels to norepinephrine'. Am. J. Physiol. 222, 82-91.)
This pattern of active constriction is important in relation to the possibility of active closure of blood vessels. For a number of years it was assumed that a fixed amount of active tension is developed by the smooth muscle for a given stimulus, independent of vessel diameter. Under these conditions a vessel whose internal pressure is slowly reduced would reach a point at which the active tension coupled with the elastic restoring force in the wall exceeded the distending pressure; the vessel would then close. The pressure at which this was postulated to occur is called the 'critical closing pressure'. This concept has been useful in developing ideas of how active and pressure forces are interrelated; but on the basis of the evidence described above it must now be re-examined, for as distending pressure is reduced so too is the active tension which opposes the pressure force. This is not to say that vessels cannot close under any circumstances for clearly spasm does occur.
13.3.2 Mechanical properties of the capillaries. When a capillary is viewed under the microscope it does not appear to pulsate in the way that an arteriole does. However, if the venous end of a capillary is occluded the red cells trapped within the upstream section of the capillary oscillate back and forth in time with the heart beat and can be seen to pack slowly towards the occluded end. The slow movement of the cells is due to filtration of fluid out of the vessel, as will be explained later, but the fast, oscillatory movement is thought to result from a very slight distension of the capillary during systole. On the basis of measurements of this cell motion and of the oscillatory upstream pressure, the stress-strain relationship of the capillary has been studied and an effective Young's modulus calculated to be of the order of 3 x 10⁵ N m-2.
Typical transmural pressures across the capillary wall are in the region of 0.3 x 10⁴ N m-2 (25 mm Hg). Thus for a capillary of 7 mm internal diameter, the total tension in the wall is approximately 1 x 10⁻² N m-1. If we consider the capillary to be simply a tube floating in the interstitial fluid, then this tension has to be accommodated solely by the endothelium and basement membrane. If we assume that it is supported by the inner and outer membranes of the endothelial cell (each membrane being 10 nm thick), then the effective Young's modulus of the membrane would have to be approximately 1.3 x 10⁷ N m-2. Such a Young's modulus is far higher than that normally expected for cell membranes and thus it is unlikely that they are responsible for the support. If the support is by the basement membrane (20 nm thick) then its Young's modulus would also have to be about 1.3 x 10⁷ N m-2. In fact the basement membrane of renal tubules, which appears very similar to systemic capillary basement membrane (but slightly thicker), has been calculated to have a Young's modulus of 0.7-1.0 x l07 N m-2. Therefore it is possible that the basement membrane could be responsible for supporting the tension in the wall. If the total tension were accommodated by the whole wall (approximately 0.7 mm thick) then on the assumption that it is a gel-like material, its Young's modulus would be approximately 4 x 10⁵ N m-2.
However, an alternative hypothesis has been developed to explain the mechanical properties of the capillaries. This supposes that the capillary should be considered not simply as a tube but rather as a tunnel within the interstitial tissue and that its elastic properties are derived from those of the tissue. This is known as the 'tunnel in gel' model. A mathematical analysis has been made of the distensibility of such a tunnel. The distensibility (D) of the capillary (radius R) is defined as (l/A)(dA/dp) where A is the cross-sectional area and p the distending pressure (see Equation 12.8)). The analysis shows that the distensibility of the capillary when considered as a tunnel compared with that of a simple tube is approximately given by

where Et and Eh are the Young's moduli of the tube wall and surroundings respectively. The capillary wall thickness is h and s is the Poisson's ratio of the surrounding material. If it is assumed that the elastic properties of the capillary and surroundings are the same and that the tissue is isotropic and incompressible (s = 0.5), then for a capillary of typical dimensions the tunnel is approximately one third as distensible as the tube.
On the basis of measurements of capillary distensibility the effective Young's modulus of the gel surrounding such a tunnel would be of the order of l.5 x 104 N m-2. Thus the interstitial tissue could be capable of providing significant support for the capillary. Further experiments are needed to distinguish between the 'tunnel in gel' and 'tube' models; it may be that in different tissues, support of the capillaries is provided by these mechanisms in different proportions.
13.3.3 Elastic properties of the venules. The postcapillary venules, whose structure is similar to that of capillaries, appear also to be rather stiff vessels. The larger venules on the other hand contain smooth muscle and are probably more distensible but little is known of their detailed stress-strain properties. At low transmural pressures, considerable increases in vessel size can be achieved with only small increments in pressure, but this is probably largely the result of collapsed vessels being opened up. It has been estimated that these vessels contain approximately 25 per cent of the total blood volume and that as a result their calibre greatly affects the volume distribution of blood within the circulation. (The detailed mechanics of the collapse of vessels is considered in Chapter 14.)
Measurements of the distensibility of the venular system (with zero arteriolar pressure) have indicated that when venous perfusing pressure is raised from a resting value of zero to 0.4 x 10⁴ N m-2 (30 mm Hg), the vessel diameter rises more than 90 per cent above its resting value; thereafter diameter rises little as pressure is raised as high as 0.9 x 10⁴ N m-2 (70 mm Hg). Other experiments, in which venular dimensions were measured while venous pressure was maintained at zero but arteriolar perfusing pressure varied, indicated that vessel calibre was affected but increased linearly to only about 130 per cent of its resting value as arteriolar pressure was raised from zero to 2 x l04 N m-2 (150 mm Hg). The effect of venous pressure on vessel volume is thus very great indeed, since raising venous pressure from zero to 0.13 x 10⁴ N m-2 (10 mm Hg) produced a 200 per cent rise in volume, and elevation of the pressure to 0.4 x 10⁴ N m-2 (30 mm Hg) produced an increase of approximately 350 per cent above resting volume. At higher pressures the volume changes were slight (about 20 per cent) because of the greatly increased vessel stiffness.
13.4.1 The distribution of pressure. Many attempts have been made to obtain representative information about pressures within capillaries and the feeding and collecting vessels; numerous isolated measurements have been made in vessels of varying size. However, enormous scatter is evident in the reported data for two main reasons. First, vessels of a given size in different preparations, or even within a single bed, do not necessarily serve precisely the same function. Secondly, pressures within vessels show periodic fluctuations which can be quite considerable; such variation can result both from local lactors and from changes in central arterial and venous pressures. Perhaps one of the clearest impressions gained from any visual study of the microcirculation is that at any instant the blood flow in about a quarter of the vessels is either stopped or sluggish.
Recently, a very extensive survey has been made of the distribution of pressures within the mesentery of the cat, which provides a clear idea of the pressure profiles within a single microcirculatory bed. (It must be appreciated that the mechanical properties of the mesenteric bed may be unusual and therefore caution must be exercised in generalizing from these results.) The vessels of the bed may be divided into five main groups on the basis of size. First, there is the rather heterogeneous group of arterioles ranging from about 50 mm to 20 mm; then there are the highly contractile precapillary vessels. These both comprise the feeding system. After the capillaries there are first the non-contractile postcapillary vessels, which are essentially wide capillaries with diameters from 10 mm to 20 mm. These are followed by the larger, and contractile, collecting venules (20-50 mm).
Measurements in all the groups of vessels indicated that the pressures within two vessels of similar size commonly differ by as much as 0.26-0.33 x 10⁴ N m-2 (20-25 mm Hg); these differences were not however the consequence of short term temporal fluctuations such as the pulse. The pressure measured within a given vessel remained virtually constant over periods of 2-3 minutes apart from small cardiac oscillations, and over longer periods would vary by only about 0.04-0.05 x l04 N m-2 (3-4 mm Hg) even though there were considerable variations in local blood flow.
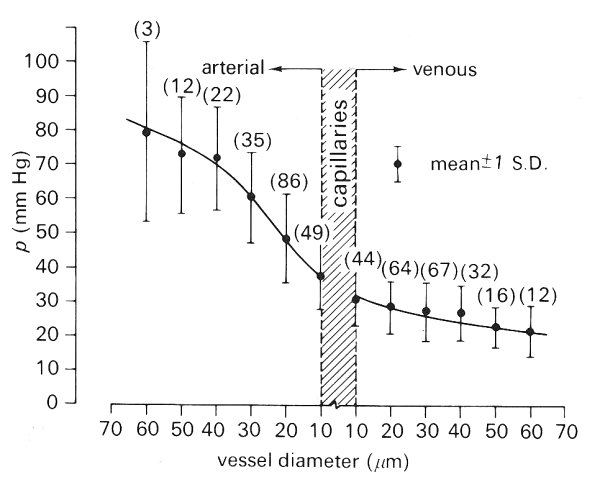
Fig. 13.16. Distribution of pressures in cat mesenteric vessels less than 60 mm diameter. A smoothed line of best fit is shown together with the standard deviation for each of the designated vessel groups. The means were computed for ±5 mm intervals about each abscissa point. The numbers in parentheses indicate the number of vessels sampled for each interval. (From Zweifach (1974). 'Quantitative studies of microcirculatory structure and function, I. Analysis of pressure distribution in the terminal vascular bed in cat mesentery'. Circulation Res. 34, 843-57. By permission of the American Heart Association Inc.)
Fig. 13.16 shows the pressure distribution found in this study for vessels in the mesenteric bed smaller than 60 mm in diameter. The range of pressure is somewhat larger in the largest arterioles than it is in the more distal vessels. Whilst the greatest fall in pressure is seen to be in the vessels before the capillaries (approximately 70 per cent), the pressure gradient through the bed shows a somewhat different pattern. As shown in Fig. 13.17, the pressure gradient increases as vessel size is decreased, which is consistent with any viscous flow theory (Chapter 5).
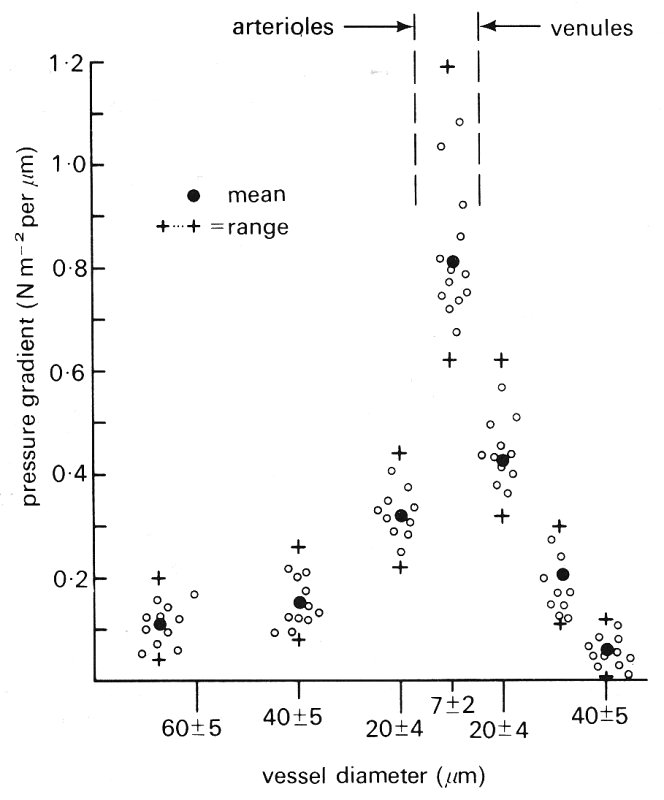
Fig. 13.17. Pressure gradient measured by two microprobes separated by the maximum distance possible between branches. In arterioles, the gradient was measured along a 1500-2500 mm interval; in venules longer segments were usually available, 2000-3000 mm. In the capillary region, the probe separation was usually 200-350 mm. Values cover a diameter range of ±5 mm for each or the categories listed, except for capillaries in which the range is ±2 mm. (From Zweifach (1974). 'Quantitative studies of microcirculatory structure and function, I. Analysis of pressure distribution in the terminal vascular bed in cat mesentery'. Circulation Res. 34, 843-57. By permission of the American Heart Association Inc.)
The data presented in Fig. 13.16 were obtained from cats whose central arterial pressures were in the normal range of 1.31-1.85 x 10⁴ N m-2 (101- 142 mm Hg). Data were also obtained in other groups of cats which were found to be hypertensive with pressures in the range 1.85-2.54 x l04 N m-2 (142-194 mm Hg) and hypotensive with pressures of 0.78-1.31 x l04 N m-2 (60-100 mm Hg) and are shown in Fig. 13.18. The pressure drop in small arterioles and precapillaries in the hypertensive cats was greater than in the normals, while it was less in the hypotensive animals. Consequently pressures in the capillaries and postcapillary vessels were similar in the two groups, the difference between the mean pressures being only 0.04-0.06 x 10⁴ N m-2 (3- 5 mm Hg). Locally applied vasoactive substances were also observed to produce changes of pressure which were greatest in the small arterioles and precapillary vessels, the effects on capillary and venular pressure being far less.
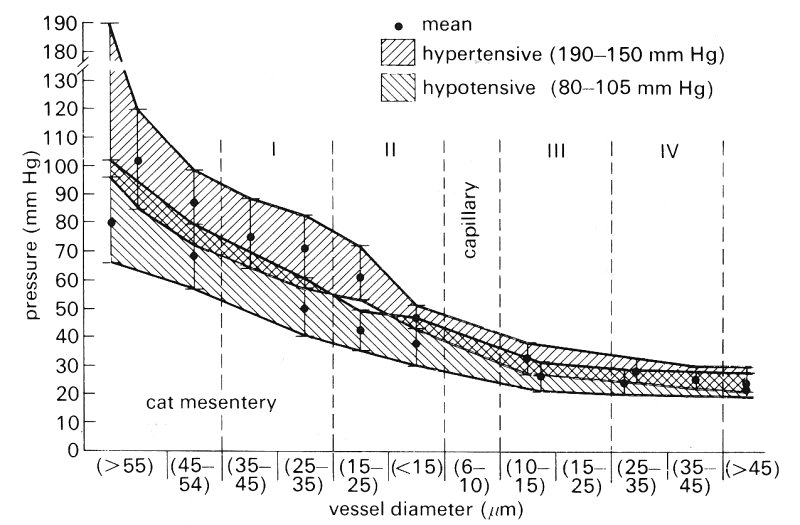
Fig. 13.18. Pressure distributions in the vessels of cats with hypertension and hypotension. The range of pressures was broader in the hypertensive group. Note the trend for pressure to converge rapidly in the pre-capillary (15-20 mm) region. Post-capillary pressures were essentially the same for all groups (twelve hypertensive, eight hypotensive cats). (From Zweifach (1974). 'Quantitative studies of microcirculatory structure and function, I. Analysis of pressure distribution in the terminal vascular bed in cat mesentery'. Circulation Res. 34, 843-57. By permission of the American Heart Association Inc.)
These observations strongly suggest that alterations in central arterial pressure are only very weakly reflected in the capillaries, and that pressures there are strongly influenced by local factors.
A further observation in these experiments was that pressures in about 10 per cent of the venules were sometimes higher than expected (approximately 0.9 x 10⁴ N m-2 (70 mm Hg) compared with the usual value of 0.4 x 10⁴ N m-2 (30 mm Hg). It might be thought that these pressures reflect the stoppage of flow, for example by large leukocytes, but this is unlikely because such blockage would be expected to occur farther upstream. The finding therefore suggests the probable existence of shunts (such as thoroughfare channels) by-passing the capillary system.
Within the capillaries themselves the pressure distribution showed two particular variations. The average capillary pressure varied by up to 0.13 x 10⁴ N m-2 (10 mm Hg) between different sectors of the mesentery and also varied as much within the same local area. However, the pressure within particular capillaries remained fairly constant over long periods; vessels in which the average pressure was as high as 0.5 x 10⁴ N m-2 (40 mm Hg) or as low as 0.26 x 10⁴ N m-2 (20 mm Hg) maintained these average levels over several minutes. As might be expected, the capillaries which arose from the proximal end of the arterioles had in general higher pressures than those arising more distally.
There were several time scales of pressure variation within a given capillary. First, there were cardiac oscillations, which could be observed throughout the length of the capillary. Their normal amplitude was about 0.01-0.02 x 10⁴ N m-2 (1-2 mm Hg) (Fig. 13.19) but could increase to about twice this level if the precapillary sphincter became dilated. The propagation of these oscillations through the microcirculation is discussed below. The second form of fluctuation was one lasting for 15-20 s and was associated with pressure variation in the region of 0.04-0.07 x 10⁴ N m-2 (3-5 mm Hg); the pattern of such changes was random. The third type of pressure variation was more substantial and lasted longer; it was in the region of 0.13 x 10⁴ N m-2 (10 mm Hg) and occurred over a period of 5-8 min, followed by a return to the steady state condition in about 2-3 min.
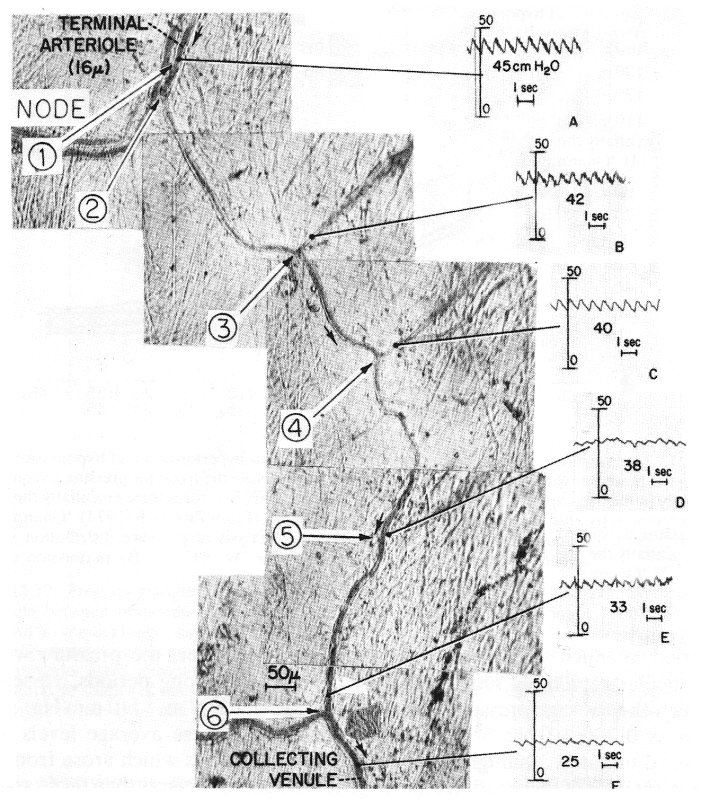
Fig. 13.19. Photographic reconstruction of capillary from arteriole to collecting venule with direct recordings of pressure and mean values taken at the points indicated. The capillaries ranged from 7-5 mm to 9 mm in width. Note the persistence of the pulse throughout. Each reading was taken at a side branch so as not to interrupt the flow through the feeding capillary. (From Zweifach (1974). 'Quantitative studies of microcirculatory structure and function, II. Direct measurement of capillary pressure in splanchnic mesenteric vessels'. Circulation Res. 34, 858-66. By permission of the American Heart Association Inc.)
Although local pressure does vary with time, an indication of the progressive fall in pressure with distance along a capillary can be obtained from Fig. 13.19 where the pressures at various sites in a capillary are shown. Pressures were obtained by introducing a micropipette into a side branch and occluding it to obtain a local lateral pressure in the capillary without causing any local flow disturbances or blockage.
Attempts have been made to develop mathematical models to predict the distribution of pressures within the microcirculation. However, these have met with only limited success for perhaps two main reasons. First, it is difficult to relate the model predictions to the experimentally measured varying pressure fields. Secondly, in all models, blood is treated as though it were a homogeneous Newtonian fluid and flow conditions are everywhere Poiseuille in form. From what has been said already in Chapter 10, these assumptions are probably unacceptable, and this is confirmed later in the chapter (§13.5.4). The results of one such attempt are presented in Fig. 13.20 where a typical sector of the cat mesentery is shown in (a); artery and vein pairs lie together dividing the mesentery up into what are considered to be triangular sectors.
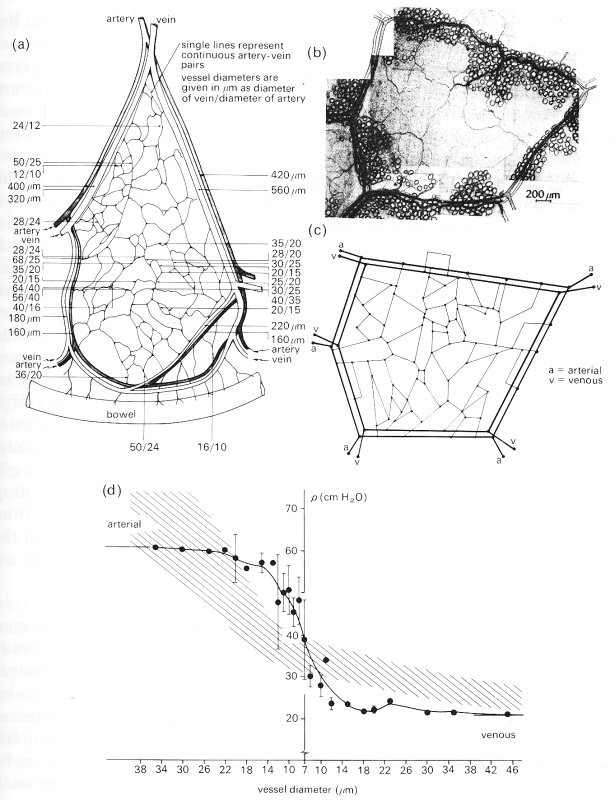
Fig. 13.20. (a) A schematic representation of a typical sector of the mesentery of the cat. Such sectors are bounded by relatively large arteries and veins running in pairs.
(b) Micrograph of a typical unit found within a sector in which the capillary network is bounded by pairs of arteries and veins.
(c) Schematic representation of the network of vessels depicted in the micrograph of (b).
(d) The distribution of pressure within the model unit of (c) (continuous line) computed as described in the text. The cross-hatched region represents the band of pressures measured in vivo in 150 different units.
(From Lipowski and Zweifach (1974). 'Network analysis of microcirculation of cat mesentery'. Microvascular Res. 7, 73-83.)
Within each sector are numerous units bounded by smaller artery-vein pairs (b); such a unit may be schematically represented as shown in (c), where all vessels are assumed to be straight and inter-connected as shown. From a knowledge of pressures and flow-rates within the boundary vessels and the assumption of Poiseuille flow in all vessels in the network, the distribution of pressure in the system was computed. It is plotted against vessel size in (d). The predictions may be compared with the experimentally measured distribution obtained in a large number of such units (cross-hatched region). The experimental distribution is very similar to that shown in Fig. 13.16, but the prediction differs significantly. The predicted curve would suggest that there is a very steep fall in pressure at the level of the capillaries whereas experiment shows most of the pressure drop to be in the vessels just before the capillaries. This discrepancy may result from several factors, but one obvious weakness of the theory is its neglect of the anomalous viscous properties of blood flowing in small vessels, which are discussed later in this chapter.
13.4.2 The propagation of cardiac pressure oscillations. Fig. 13.19 shows that pressure oscillations of cardiac origin persist all along a microcirculatory pathway although they are significantly attenuated. These oscillations have been further studied in other experiments in which the pressures were measured simultaneously at the entrance and exit of one capillary. These revealed phase differences which confirmed that the pulse propagates from the arterial end of the pathway towards the venous end. The speed of propagation within the capillary can be deduced from the observed phase changes (25° phase lag between small arteriole and small venule at a heart rate of 2.5 Hz) if the distance between the pressure measuring sites is known. Unfortunately this distance was not reported, but we would expect it to lie somewhere in the region of 2000 mm. Taking this value, one predicts a propagation speed of 7.2 cm s-1. The pulse amplitude is attenuated by about 30 per cent between the two sites, which is equivalent to attenuation of 83 per cent per cm if the attenuation is exponential (see §8.4).
The mechanism of pulse propagation in the microcirculation is not the same as in arteries, because of the fact that inertia is negligible. In an artery, the pulse propagates as a wave, in which the elastic restoring force of the wall is balanced by inertia of the blood, as explained in §12.3.2. This mechanism brings the pulse to the small arteries and large arterioles, where the Womersley parameter a is close to 1. The pressure therefore oscillates at the entrance to the smaller vessels where a is less than 1. In the microcirculation, the elastic pulsations of the wall are resisted by viscous forces, not inertia forces, in the fluid. When the wall of a small vessel has been locally expanded by high pressure, its elasticity pulls it back towards its equilibrium position, forcing fluid out into the low pressure region downstream. This causes the vessel wall in that region to expand, driving the pressure up so that the process is repeated farther down-stream, and so on. Unlike the situation in arteries, however, viscous forces prevent the wall from overshooting its equilibrium position. Thus oscillations are 'over-damped', like the oscillations of a simple pendulum in a highly viscous fluid (see §8.3). Because viscous resistance involves the dissipation of mechanical energy, the amplitude of the pulse is rapidly attenuated.
This process can be analysed, if blood is taken to be a Newtonian fluid, by using the general theory for wave propagation in an elastic tube with a very small value of a (this theory is described in Chapter 12, and the results shown in Fig. 12.36, §12.6.2); the speed of propagation c of a sinusoidal pulse is predicted to be

where d is the capillary diameter, D is its distensibility, w is the angular frequency of the pulse, and m, is the blood viscosity. A propagation speed of about l0 cm s-1 is predicted for a wave of frequency 2.5 Hz in a 10 mm capillary. Furthermore, the pulse is predicted to be very sharply attenuated, by a factor of about 99.8 per cent per wavelength (k=2p: contrast the large a-result given in §12.6.2), which is equivalent to about 80 per cent per cm. The difference between the predicted values and the measurements quoted above is a result of the over-simplifications involved in the theory, including the neglect of tissue visco-elasticity and the non-Newtonian properties of blood.
13.4.3 Pressure in the interstitial space. When considering the static mechanical properties of the various blood vessels we showed how diameter and area are related to the effective distending pressure (transmural pressure) of the vessel. However, in practice the internal pressure of the vessels is measured relative to atmospheric, and it is tacitly assumed that extravascular pressure (the pressure within the interstitial space) is atmospheric. This is an important assumption when the transmural pressure is small, and must be considered carefully.
Numerous methods have been used to measure interstitial pressure, with different results. The obvious method, of inserting a fine needle into the tissue, usually gives a reading close to atmospheric pressure and for a long time this was believed to be the true pressure. In fact this method is inappropriate because it causes tissue damage and distortion.
More recent methods of investigation usually give values which are negative relative to atmospheric pressure. The precise value depends upon the technique, the species studied and the site of measurement; most values lie in the range 0-0.9 x 10³ N m-2 (0-10 cm H2O).
Two principal methods of measurement have been developed and it is important for us to consider them briefly in order to appreciate the difficulty of interpreting the experiments. The first method involves implanting into the subcutaneous tissue space a small hollow porous capsule (approximately 1 cm diameter), which is left in the tissue for approximately three weeks. During this time the surfaces of the capsule become covered with loose connective tissue and the core is filled with fluid. Then, a fine needle is inserted into the centre of the capsule and the fluid pressure measured; a negative pressure is usually obtained. The technique assumes that the capsule contents and the surrounding interstitial space have come into equilibrium. It further assumes that the osmotic pressure of the fluid within the capsule is the same as that in the tissue space; thus the measured hydrostatic pressure within the capsule will be the same as that in the surrounding tissue. However, the fluid contents and structure of the material within the capsule do not appear to be the same as in the interstitial space, and therefore the assumption that the osmotic pressures are equal is questionable. Thus the measurements should be viewed with some reservation.
The second method involves the implantation of a cotton wick into the space. A few strands of cotton are placed inside a narrow polythene cannula with approximately 1 cm of wick exposed at one end, a pressure transducer is fixed to the other end and the whole assembly is filled with isotonic saline. The wick end of the cannula is introduced into the subcutaneous space via a needle which is then removed and the cannula is left undisturbed; fibres of the wick are assumed to maintain hydrostatic communication between the cannula and the interstitial space by providing tiny channels. Within an hour the measured pressure becomes approximately constant and is considered to represent the interstitial fluid pressure; a negative value, similar to that obtained with the capsule technique, is observed.
A possible cause of sub-atmospheric tissue fluid pressure is the partially hydrated gels, made up of very large molecules such as hyaluronic acid, which are present in the interstitial space, and tend to imbibe water. The gel phase will tend to swell by extracting water from the liquid phase (sol) and those protein molecules in solution in the sol which are too large to enter the structure of the gel become concentrated. Thus tissue osmotic pressure is raised. Unless water entering from the vascular space is removed continuously from the interstitial space, the latter will swell until the gel is fully hydrated. Then the sol would equilibrate osmotically with the plasma, and the interstitial pressure would increase to atmospheric or above. Dehydration is maintained by removal of the water via the lymphatics and re-absorption by the venules. It follows that the osmotic pressure in the interstitial space is normally slightly above the plasma osmotic pressure. If a cannula, containing saline of the same colloid osmotic pressure as plasma, is inserted into the space water will tend to be drawn out of it. On the other hand the tissue gel cannot enter the cannula, so a negative pressure will be recorded.
Pressures within the lymphatic capillaries have been measured with micro-pipettes, and found to be slightly positive. It has been argued that these pressures reflect the pressure within the interstitial space since the lymphatic capillaries are in free hydrostatic communication with their surroundings because their endothelium is discontinuous. However, we have already seen (§13.2.4) that the discontinuous endothelial cells overlap each other, and the proponents of negative interstitial pressure argue that hydrostatic continuity occurs only when the interstitial space experiences a compression force, due for example to muscle contraction. Interstitial hydrostatic pressure then becomes positive, exceeding that within the lymphatics. It is postulated that these are held open by the anchoring filaments shown in Fig. 13.12 and therefore flow into them can occur.
In summary it seems that the existing methods all effectively measure the osmotic pressure within the interstitial space and not the true hydrostatic pressure. To measure this would require a probe filled with a fluid with the same colloid osmotic pressure as the tissue sol, and of dimensions less than the tissue fluid spaces. Thus there are drawbacks to all existing methods, but the bulk of the observations suggest that interstitial pressure is slightly subatmospheric.
Any analysis of flow in the microcirculation involves a consideration of the particulate nature of blood, for as we have already seen when considering blood viscosity measurement (Chapter 10) anomalous behaviour occurs when blood flows through gaps comparable in size to the red cell. As with so many other aspects of microcirculatory mechanics, much of our understanding is inferred from studies of particulate suspensions or whole blood flowing in glass tubes. The concentration of red cells in blood is far greater than that of any other formed elements, and the details of the flow are dominated by the red cells. The discussion that follows is thus mainly concerned with the behaviour of red cells in the flow. The motion of blood has been shown to be similar in many ways to that of suspensions of model spheres, discs and rods. We shall therefore look at such flows first, building up in complexity from single to multiple particle suspensions and from tubes much larger than the particle to tubes where there is a tight fit and the particles move in single file. In all cases we are concerned with flows in which the tube or vessel Reynolds number is usually low, that is less than unity, and in which the wall shear-rates can be as high as 1000 s-1.
13.5.1 The motion of single particles at very low flow-rates. We will first consider the behaviour of single spheres, rods, or discs suspended in a Newtonian fluid of the same density, flowing extremely slowly in a long straight tube with the tube Reynolds number less than one. This is the simplest case, because particle interactions and collisions cannot occur. When there are no particles present, the fluid downstream from the entrance region flows with the characteristic parabolic velocity profile of Poiseuille flow, and the velocity gradient or shear-rate G at any radial position r in the flow will increase linearly from zero at the axis to a maximum at the wall. (See Fig. 13.21 and Chapter 5, §5.1)
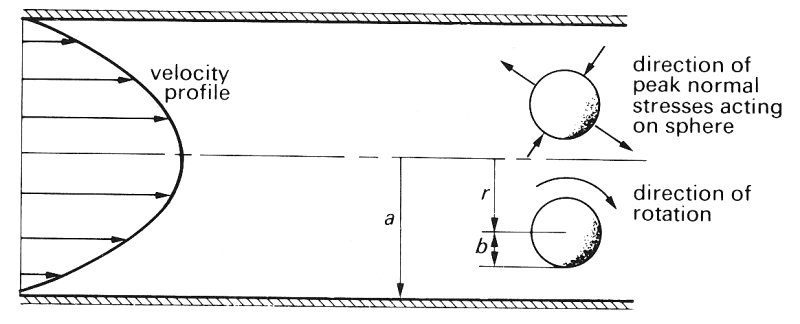
Fig. 13.21. The effects of suspending a neutrally buoyant rigid sphere of radius b in Poiseuille flow in a tube of radius a. The sphere rotates in the direction indicated whilst moving along the tube at a constant radial position r. The sphere is also subjected to a varying normal stress over its surface;
The motion of spheres. If we introduce into the flow a small rigid sphere which is neutrally bouyant we shall observe first that it moves along with the flow and secondly that it rotates at a constant angular velocity about a transverse axis. The speed of translation along the tube is slightly less than the velocity u the fluid would have at the centre of the sphere; the difference (known as the slip velocity) increases as the particle size increases. The rotation results from the distribution of shear-rate over the particle surface, and takes place in the sense the stress is compressive over part of the surface and tensile over the remainder. shown in Fig. 13.21 and earlier in Fig. 10.2. The sphere also experiences a varying stress normal to its surface as shown in Fig. 13.21; thus part of the surface is subjected to compression while the remainder experiences a tensile stress. At these very low flow-rates the rigid sphere is observed to move along the streamlines of the flow and not experience any migration across them.
The behaviour of an immiscible fluid drop (i.e. a flexible sphere) introduced into the same flow is very different from that of a rigid sphere. Because of the variation in normal stress around the surface of the drop, it tends to be deformed into an ellipsoid, as shown in Fig. 13.22.

Fig. 13.22. The deformation and rotation of a fluid drop flowing in a shear field such as the Poiseuille flow in Fig. 13.21. The internal fluid circulation patterns are also shown.
At equilibrium the fluid stresses tending to distort the drop are balanced by the interfacial tension forces which tend to restore the spherical shape. Close inspection of the surface of the drop shows that it is rotating in the same direction as a solid sphere rotates; but in addition the interior fluid rotates as shown in Fig. 13.22. It is also observed that the drop migrates radially towards the axis of the tube from whatever radial position it originally occupies (Fig. 13.23). The radial migration velocity is greatest nearest to the wall and decreases as the drop moves towards the axis. It has been shown theoretically that this radial migration results from the deformability of the drop, the distribution of shear-rate in the fluid and the presence of the wall. As the deformability becomes less, so does the migration velocity. The migration velocity increases as the particle size increases relative to the tube radius, and as the flow-rate (and thus the gradient of shear-rate across the drop) increases. Clearly if the drop was flowing along in a region of uniform velocity, there would be no shear forces, no deformation and as a result no migration.

Fig. 13.23. Photomicrographs of the deformation and accompanying radial migration of a suspended drop; the camera was moved along the tube at the speed of the drop. (a) Drop at rest near wall. (b), (c), (d) successive radial positions of the drop deformed into an ellipsoid as liquid flows upward through the tube. Note that there is migration from the wall, the rate decreasing with the decreasing deformation and shear-rate as the drop moves towards the axis. (600 mm drop, tube diameter 0.8 cm (ratio tube/particle diameter = 13).) (From Mason and Goldsmith (1969). "The flow behaviour of particulate suspensions'. In: Circulatory and respiratory mass transport (ed. Wolstenhoime). J. A. Churchill, London.)
The motion of rods and discs. The motion of rigid rods and discs is somewhat more complicated than that of rigid or liquid spheres. Translation of such particles along the tube is still associated with rotation because even when the rod axis or disc plane is parallel to the flow there is still a velocity gradient across it, as shown in Fig. 13.24; but the rotation is no longer at a constant angular velocity. Because the force causing their rotation increases as their angle j to the flow increases, both rods and discs tumble as they move along the tube. They spend most of the period of rotation aligned with their long axis nearly parallel to the flow and flip rapidly in the remainder of the cycle.
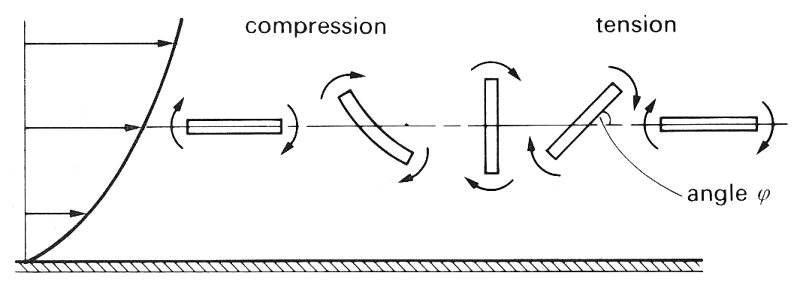
Fig. 13.24. The rotation of rods and discs in a sheared flow. Notice that, if the rod or disc is flexible, it may become deformed, as shown, during the compression part of the cycle.
Flexible rods and discs are also subjected to deformation as shown in Fig. 13.24 as a result of the alternating compression and tension on the particle. .Flexible particles are also observed to migrate towards the tube axis in a similar way to deformable liquid drops. Rigid rods and discs do not show this migration at low flow-rates.
13.5.2 The motion of single particles at high flow-rates. At higher Reynolds numbers (greater than unity) where inertial forces become important within the flow, deformable bodies still migrate towards the tube axis. But in this case rigid particles also migrate, though this migration is not always from wall to axis.
The behaviour of rigid particles under these conditions is referred to as the 'tubular pinch' effect or 'Segre-Silberberg' effect after those who first reported it. Particles initially near the wall move towards the axis and particles near the axis move towards the wall; they all move towards an equilibrium radial position approximately 0.6a from the axis, where a is the tube radius. The migration velocity depends upon radial position and decreases as the equilibrium location is approached; the velocity increases with Reynolds number and as the particle size increases relative to tube size. The underlying mechanisms controlling the motion are complex and involve both the inertia of the fluid and the interaction of the particle with the wall.
The types of motion of rigid and deformable particles at very low and somewhat higher flow-rates are summarized in Fig. 13.25. It is clear that, except for rigid particles at very slow flow-rates, there is always a migration of particles away from the tube wall.
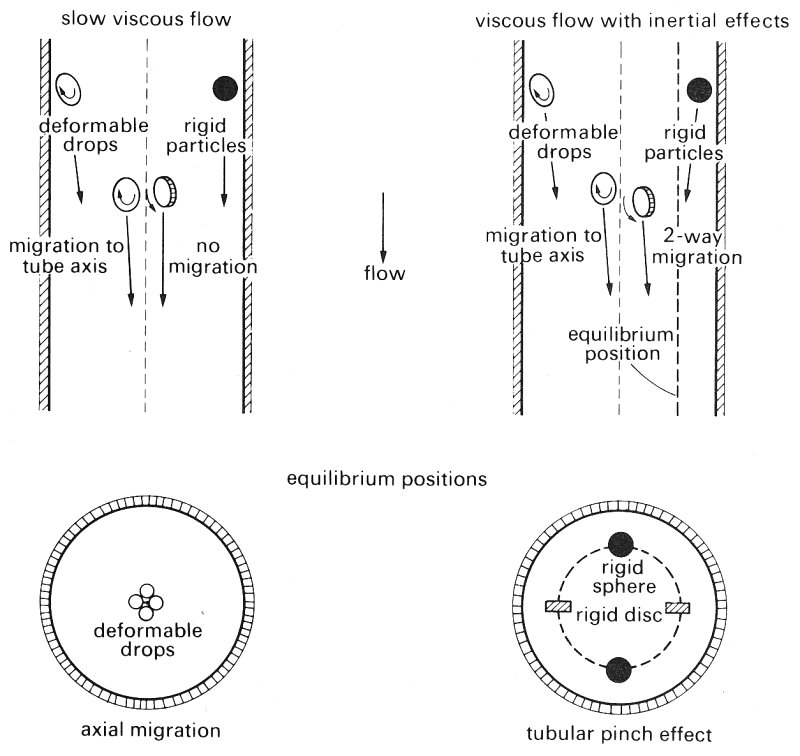
Fig. 13.25. Schematic representation of the differences in the observed migration of rigid and deformable particles in the median plane of a tube, on the left at very low Reynolds numbers, and on the right at Re significantly greater than 1. In the lower part, the tube is shown end on with the equilibrium positions reached in migration due to particle deformation (left) and that due to inertia of the fluid—the tubular pinch effect (right). (After Goldsmith (1971). 'Red cell motions and wall interactions in tube flow'. Fedn. Proc. Fedn. Am. Socs. exp. Biol.. 30, 1578-88.)
13.5.3 The motion of single red blood cells in Poiseuille flow. The motion of isolated red cells in plasma reflects the behaviour of both rigid and deformable particles. When the tube flow-rate is low enough for the local shear-rate (G) in the vicinity of the cell to be less than approximately 20 s-1 the cell is seen to rotate like a rigid disc, retaining its biconcave shape. The flipping and the periodicity of rotation are just as would be predicted for a rigid disc of the same diameter, and the cell also rotates about its minor axis in the same manner as a rigid disc. This behaviour is summarized in Fig. 13.26. At these low shear-rates the cells spend approximately 50 per cent of the time with their major axes aligned within ± 20° of the direction of flow and do not exhibit axial migration.

Fig. 13.26. The effect of suspending rigid discs and human red cells in Poiseuille flow at shear rates below 20 s-1..The figure shows tracings from photomicrographs of the rotating particles at various orientations in one half revolution. The dashed line shows the axis of revolution of the particles whose angular velocities are greatest at positions 1 and 5. (After Goldsmith (1971) 'Red cell motions and wall interactions in tube flow'. Fedn. Proc. Fedn. Am. Socs. exp. Biol. 30, 1578-88.)
At shear-rates greater than 20 s-1 the behaviour of normal red cells progressively changes from that of rigid discs. The cells spend a greater time with their orientation close to that of position 3 in Fig. 13.26. At shear-rates in excess of 100 s-l the vast majority of the cells are observed to lie in position 3. Careful study of the cell membrane suggests that it is in motion round the interior. Measurement of the cell dimensions indicates that it has become deformed but that its biconcave shape is retained. At these higher shear-rates, radial migration from the wall is also observed, and the migration velocity increases with the rate of shear. At very high shear-rates of the order of 5000 s-1, single red cells experience the tubular pinch effect, but with an equilibrium position nearer to the axis than would be obtained with a rigid disc.
At shear-rates less than about 50 s-1, rouleaux (Chapter 10, §10.3.2) can be observed in the flow; these behave just like flexible rods, and exhibit strong radial migration. As the shear-rate is increased, the rouleaux become progressively broken down in size by the stretching and shearing forces acting during their rotation.
Studies have also been performed with red cells which have been hardened with glutaraldehyde. Such cells behave like rigid discs at all shear-rates (Fig. 13.27) and do not exhibit radial migrations until shear-rates are high enough for the tubular pinch phenomenon to occur.
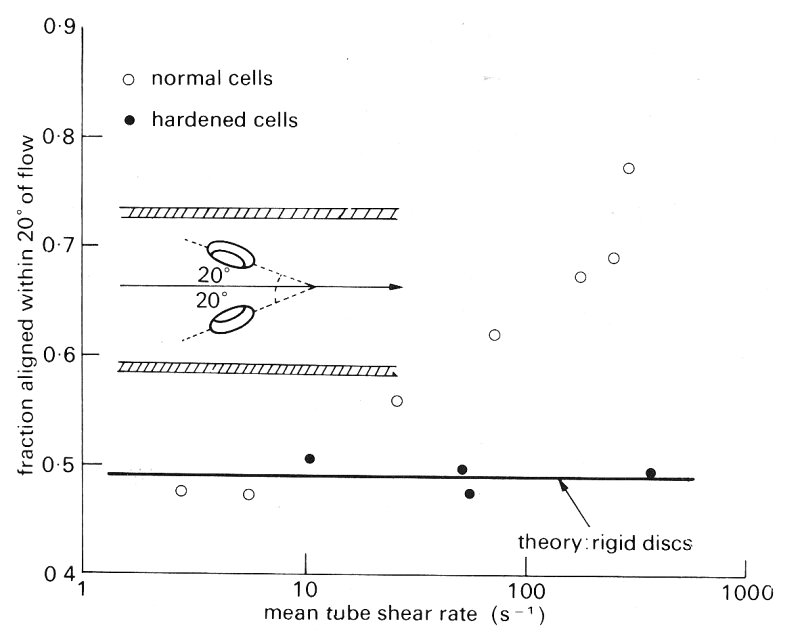
Fig. 13.27. Fraction of normal and glutaraldehyde-hardened cells lying with their major axes oriented within ±20° of the direction of flow (as illustrated) as a function of the shear rate. The horizontal line showing an orientation distribution independent of shear-rate is that calculated for rigid discs whose periods of rotation at a given shear rate are the same as those of human red cells. (After Goldsmith (1971). 'Red cell motions and wall interactions in tube flow'. Fedn. Proc. Fedn. Am. Socs. exp. Biol. 30, 1578-88.)
We have already seen that the velocity profile of a fluid subjected to an oscillatory pressure gradient whilst it is flowing in a long straight pipe depends upon the value of a, the Womersley parameter. Typical values of a in the microcirculation are less than 0.08 (see Table I at the front of the book). Thus in the absence of particles we would expect quasi-steady conditions at all times. As the motion of particulate fluids is so complex, it is not safe to assume that the phenomena observed in steady flow occur also in oscillating flows. However, the few model studies which have been performed with both particles and red cells indicate that the processes described above do occur.
13.5.4 The flow of concentrated suspensions of particles and red cells. As the concentration of the flowing suspension in a tube is increased above the very low value of about 0-5 per cent, experiments have shown that particle-particle interactions or near collisions begin to occur. These progressively alter the particle motion and the velocity profile. Furthermore the red cells deform much more than they do in a dilute suspension.
Special techniques have been developed to observe the motion of individual particles and red cells in concentrated suspensions. For example, in particulate systems most of the particles have been made effectively transparent by matching the fluid refractive index to that of the particle and seeding the system with a few opaque particles. In the case of red cell suspensions, the flow is visualized by adding a small proportion of red cells to ghost cell suspensions prepared as described in Chapter 10 (§10.3.2).
To understand the behaviour of concentrated suspensions it is necessary to consider both the suspension concentration c and the relative particle size b/a (where b is particle radius and a the tube radius, Fig. 13.21). If the particles are relatively small rigid spheres and the suspension concentration below about 5 per cent, then the velocity profile (constructed from particle velocity measurements) is close to parabolic; but as the relative particle size or concentration is increased the particle velocity profile becomes progressively blunted. Flexible and fluid particles of the same concentration and relative size show less blunting of the velocity profile. This difference in behaviour can be seen in Fig. 13.28.

Fig. 13.28. Velocity profiles at very low Reynolds numbers in straight tubes for particle suspensions and ghost red cells. Local velocities (u(r)) are plotted as ratios of the centre line velocity um; this means that profiles are scaled so that centre-line velocity is unity in all cases.
In (a) velocity profiles are shown for the same concentrations of (1) large (b/a = 0.12) and (2) small (b/a = 0.06) rigid particles and (3) large (b/a = 0.12) liquid drops.
In (b) velocity profiles are also shown for suspensions of ghost red cells and rigid discs of approximately the same size and concentrations. The profiles for the ghost cells are shown at two different flow-rates.
(From Goldsmith (1972). 'The flow of model particles and blood cells and its relation to thrombogenesis'. In: Progress in hemostasis and thrombosis. By permission of Grune & Stratton Inc., New York.)
In the top figure, the velocity profiles are plotted for large and small rigid spheres and large liquid drops, all at the same concentration of approximately 30 per cent. It can be seen that at this concentration the particle velocity profile obtained with the large rigid spheres is flat, and the plug flow region, in which all spheres move with uniform axial velocity, extends right across the tube almost to the wall. Smaller rigid spheres do not show such a wide zone of plug flow in the core. When rigid sphere behaviour is compared with that of liquid drops, it can be seen that large liquid drops exhibit less blunting than rigid spheres of half their diameter.
In the case of rigid particles, the velocity profile is determined solely by the suspension concentration and relative particle size and is independent of the flow-rate. Liquid drop and flexible particle suspensions, on the other hand, show a dependence of the velocity profile upon flow-rate, in that the degree of blunting decreases as the flow-rate increases.
The lower part of Fig. 13.28 contrasts the behaviour of suspensions of ghost red cells with rigid discs of approximately the same size and concentration. The particle velocity profile for the discs contains a wider region of plug flow than is present in the case of the ghost cell suspensions. The cell suspensions also show how increasing the flow-rate causes the plug flow region to diminish. At the higher flow-rate, the ghost cell velocity profile is close to parabolic.
The detailed mechanism underlying this difference in behaviour is extremely complex, but it clearly results from the deformability of the drops and cells. In concentrated suspensions of red cells, severe deformation of the membrane is evident at low shear-rates, in the region of 3 s-1, which is very much less than the rate of about 100 s-1 necessary to deform individually suspended red cells.
It must be emphasized that these velocity profiles do not necessarily reflect the velocity profile within the fluid itself, particularly near the wall. This is obvious in the case of the suspension of rigid spheres in which the particle velocity profile was flat all across the tube; in the vicinity of the wall, the fluid velocity must decrease rapidly to be zero at the wall because of the no slip condition (§4.4). However, at least for the motion of rigid particle suspensions, the fluid velocity profile is determined by the particle velocity profile and is independent of flow-rate. This may be deduced from the fact that the 'viscosity' of rigid particle suspensions is independent of flow-rate and determined solely by particle size and concentration. Because the viscosity of these suspensions is independent of the shear-rate, they are said to be 'quasi-Newtonian'. This constancy of viscosity is not demonstrated by suspensions of droplets since their particle velocity profiles depend on flow-rate; this is presumably true also of the fluid velocity profile.
There is only qualitative evidence of radial migration in concentrated suspensions; a small depletion in particle concentration near the wall is observed and the tubular pinch effect has been reported. In the case of red cell suspensions of normal haematocrit the situation is more complicated. In flows at reasonably high shear-rates, the red cells move as individual cells and there appears to be a thin cell free layer near the wall. However, at lower shear-rates the cells tend to aggregate into rouleaux, and the cell free layer increases considerably in thickness; such an increase is to be expected because with larger particles the forces causing radial migration are larger.
13.5.5 The viscosity of whole blood. These observations on the motion of concentrated suspensions of particles and red cells provide a qualitative explanation of the observed effect of shear-rate on whole blood viscosity (Chapter 10, Fig. 10.16). At the lowest shear-rates, the majority of the blood cells combine to form rouleaux. These are long, possess a degree of rigidity, and provide an interlocking structure which makes the blood behave like a solid. As the shear-rate is increased beyond the yield stress of this solid (Chapter 10, §10.6.3), so the shearing forces bend and break the rouleaux, so that the bridging lattice breaks down. As the shear-rate is further increased the rouleaux length is progressively reduced till the suspension consists of single red cells. Observations of the distortion of flexible rods in concentrated and in dilute suspensions indicate that even at low shear-rates the rods are much more distorted when in concentrated suspension. Thus the breakdown process of the rouleaux in whole blood would be expected at very much lower shear-rates (1 s-1) than those required for dilute rouleaux suspensions. The rapidly decreasing viscosity of whole blood at rates of about 1 s-1 may thus be attributed to the breakdown of rouleaux and to the decreasing particle size.
The observed decrease in whole blood viscosity at shear-rates between about 10 and 100 s-1 is probably the result of the progressive distortion of individual red cells in the suspension. As explained above, they experience considerable distortion in concentrated ghost cell suspensions at shear-rates as low as 3 s-1. Finally at very high shear-rates (of the order of 5000 s-1) single red cells begin to behave as though they were rigid particles (§13.5.1). However, the fact that there is a plateau in the viscosity shear-rate curve of whole blood at shear-rates above about 150 s-1 suggests that red cells in concentrated suspension behave like rigid particles at this relatively low shear-rate.
13.5.6 Radial dispersion of red cells. When concentrated suspensions of red cells flow in a tube there are continuous intercell collisions and individual red cells move along very erratic paths. This behaviour has been studied using red cells in ghost suspensions, and it has been found that the magnitude of a cell's radial fluctuations depends upon its radial position (Fig. 13.29).
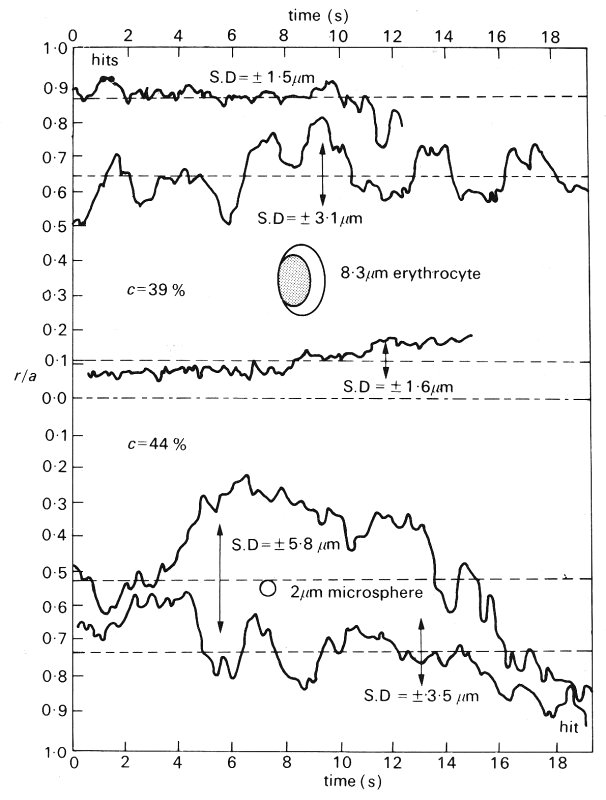
Fig. 13.29. Variation in radial position with time of tracer red cells (upper part) and polyvinyl toluene latex microspheres (lower part) in concentrated ghost cell suspensions flowing at a mean velocity of 0.015 cm s-1 through a 76.5 mm glass tube. The size of the particles relative to the tube is shown. Points at which the cell and microsphere were observed to touch the wall are marked at 'hits'. The microsphere adhered to the wall after colliding with it. (After Goldsmith (1971). 'Red cell motions and wall interactions in tube flow', Fedn. Proc. Fedn. Am. Socs. exp. Biol. 30, 1578-88.)
By measuring the radial displacements it is possible to obtain a diffusion coefficient (see Chapter 9, §9.1) for the red cells. In the example described in Fig. 13.29, the diffusion coefficient ranged from 3 x 10⁻⁸ cm2 s-1 near the tube axis to 1.5 x 10⁻⁷ cm2 s~1 at a radial position r= 0.7a. This is considerably greater than that anticipated on the basis of Brownian motion resulting from the impact of the liquid molecules, which would suggest a diffusion coefficient of the order of 4 x l0-10 cm2 s-1. It is interesting to see that the diffusion coefficient of the red cells is comparable to that which we would expect for macromolecules in free diffusion in plasma where a typical value is 1 x 10⁻⁷ cm2 s-1 for albumin in plasma at 37 °C.
The radial fluctuations of the red cells are associated with displacement of the adjacent plasma and other formed elements. Studies of the radial movements of 2 mm rigid spheres (to stimulate platelets) have shown that the displacements are even greater in a flowing red cell suspension than those of the red cells themselves (Fig. 13.29). If the diffusion coefficient is measured over short time intervals it is found to be approximately the same as for red cells at the same radial position. However, over longer time scales the coefficient is larger, as the microspheres move from the influence of one red cell to that of another. Thus we can see that the effective mobility of platelets in flowing blood is very much enhanced by the presence of the red cells.
13.5.7 The cell free layer. All the dynamic processes described above imply that when blood is flowing along a tube either steadily or in pulsatile manner, there is a tendency for cells to move away from the wall and to concentrate to some degree in the core of the tube. The effect of this is to create a layer of suspending fluid very close to the tube wall that is depleted of cells - the cell free layer. This layer is not entirely free of cells for the high core concentration and the agitated nature of the flow tend to push cells into this region where they collide with the wall (Fig. 13.29).
However, it is worth remembering that even in the absence of flow a cell free layer is formed for purely geometrical reasons. Imagine a uniformly packed bed of spheres (Fig. 13.30) in which a circle is described to represent the wall of a tube containing the spheres. Clearly spheres whose centres are closer than one sphere radius to the wall cannot fit in; this implies a reduction in sphere concentration near the wall.
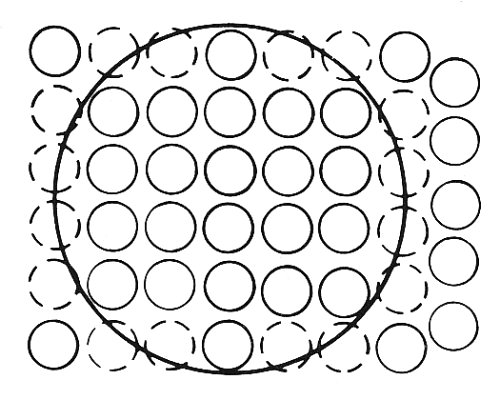
Fig. 13.30. The cell free layer which results from the impossibility of having spheres within one sphere radius of the tube wall.
In flowing blood, the thickness of the cell free layer depends upon both flow-rate and cell to tube radius ratio. It has never been measured directly with any success in vivo because of the technical difficulties of viewing through vessel walls. However, measurements in glass tubes of the order of 100 mm in diameter suggest that it is approximately 2-4 mm in thickness. The effect of this cell free layer is to create a sheath of low viscosity fluid (plasma) around the suspension which flows in the core of the tube. The physiological consequences of the cell free layer in the microcirculation may be considerable and must be examined.
The dynamic haematocrit of blood. If we measure the haematocrit of whole blood in a reservoir and flowing out through a tube attached to the reservoir, it will be found to be lower in the tube. This effect has been known for a long time and is partly responsible for the variations in blood viscosity in narrow tubes, as described later.
This reduced dynamic haematocrit is a consequence of the cell free layer, for the suspended red cells move down the central portion of the tube at a relatively fast velocity, whereas plasma also flows in the slower moving region near the wall. This effect will occur regardless of the velocity profile. As a result, the mean time for red cells to traverse a given length of tube is less than that for the plasma; if the dynamic haematocrit were the same as the static value at the entrance, then we would end up with an increased concentration of red cells at the end of the tube! In fact the dynamic haematocrit measured in any fairly narrow tube is always less than the static haematocrit, so that whilst the transit time per cell is reduced relative to the plasma the total number of cells passing through the tube in that time is maintained at the appropriate level.
Plasma skimming. If we consider a large microcirculatory vessel with a very small side vessel attached (Fig. 13.31) then it is likely that the small vessel, supplied relatively slowly from the larger vessel, will contain blood with a greater proportion of plasma than that in the parent tube. This is because the blood supply to this vessel comes mainly from near the wall in the large vessel where the blood is plasma rich. This phenomenon is known as plasma skimming.

Fig. 13.31. Plasma skimming effect of a small side vessel.
Farhaeus-Lindqvist effect. Farhaeus and Lindqvist measured the apparent viscosity of blood in tubes of various diameters from larger than 0.1 cm down to approximately 10 mm. They performed their experiments at shear-rates which were sufficiently high for rouleaux formation to be absent and for viscosity to be independent of shear-rate (Chapter 10, §10.6.3).
It was found that in tubes greater than approximately 0.1 cm in diameter, the measured apparent viscosity was independent of tube diameter. However, in smaller tubes the apparent viscosity decreased as the tube size became smaller (Fig. 13.32); even in vessels of the same diameter as the undeformed red cell, the effect is very strongly apparent.
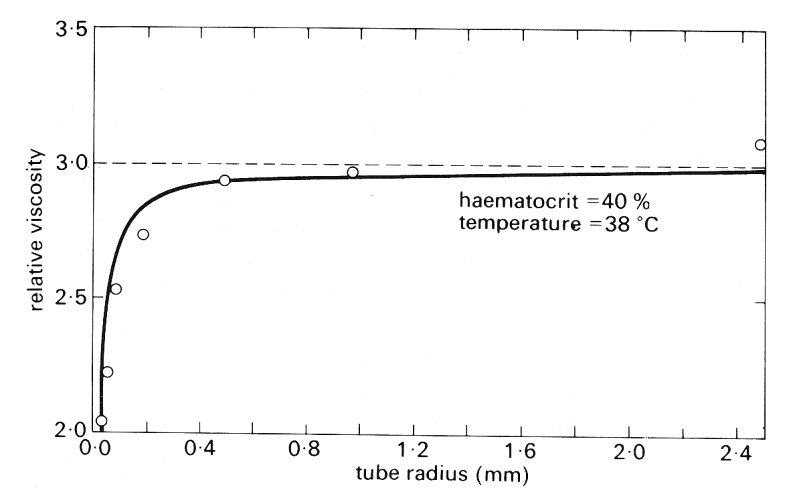
Fig. 13.32. The relationship between the apparent viscosity of blood relative to that of plasma and tube diameter in flow through narrow cylindrical tubes. (From Haynes (1960). 'Physical basis of the dependence of blood viscosity on tube radius'. Am. J. Physiol. 198, 1193-1200.)
The implication of the Farhaeus-Lindqvist effect results is that the shear stress at the wall decreases as tube size is reduced. It will be remembered from Chapter 5 that the pressure gradient causing flow along a tube is balanced by the shear stress exerted by the wall on the fluid. In turn the shear stress is determined by the product of the velocity gradient within the fluid at the wall and the local fluid viscosity. In a flowing particulate suspension such as blood, the cell free layer viscosity is reduced but at the same time the velocity gradient within the layer is greater than it would be in the presence of particles; thus the velocity gradient at the wall may be elevated. Consequently, it is not possible to be sure whether the overall effect will be an increase or decrease in wall shear stress. In a large radius tube the relative scale of the cell-free layer is small and in consequence adjustments in velocity profile within the cell free layer occur over a relatively small distance; in a small tube, however, the scale of the cell free layer increases and velocity profile adjustments can occur over a relatively greater distance; thus the velocity gradient at the wall may not be as great as expected. The second factor affecting the shear stress is the dynamic haematocrit, which falls with diminishing tube or vessel size; as a result the apparent viscosity also falls.
13.5.8 Velocity profiles in vessels. The measurement of representative flow-rates and velocity profiles in the very small vessels has proved even more difficult than the measurement of pressure. This has been mainly due to the difficulty of observing the movement of individual red cells in vessels larger than capillaries. But in addition anyone who has observed a microvascular bed in vivo with a microscope will have noted the variability of flow in a given vessel; flow can be steady for a period of time and then suddenly slow down or stop altogether. Such changes in flow-rate have not been closely correlated to vascular pressure; this is perhaps to be expected because in such a network pressures and flow-rates in adjacent vessels are related.
In capillaries, where individual red cells can be observed in the flow, flow-rates have been estimated on the basis of red cell velocity, assuming plug flow conditions in the vessel. Typical velocities measured in capillaries are to be found in Table 13.1. In somewhat larger vessels, measurements of flow-rate have recently become possible using a photometric technique involving illumination of the vessel through two closely separated slits. This technique was at one time used to measure not only average velocities but also velocity profiles across the lumen. The measurements suggested that velocity profiles were blunt. However, the technique has recently been shown to be faulty and to overestimate the blunting; there is strong evidence from other experiments that the velocity profile in whole blood flowing through narrow tubes is virtually parabolic at all haematocrits. Closely similar results are obtained with ghost cell suspensions, as indicated in Fig. 13.28. Thus it would appear that the red cell is sufficiently flexible to allow an approximately parabolic velocity profile to be established in vitro under all conditions which might reasonably be expected to occur in vivo. Until good direct experimental information is available, it is reasonable therefore to assume that velocity profiles are approximately parabolic in all vessels of the microcirculation other than capillaries. However, the cell free layer very near the wall may have a marked effect on the value of the shear-rate at the wall and hence it would not be appropriate to compute the pressure drop along a vessel on the basis of the velocity profile in the core of the vessel.
The flow conditions in the vicinity of vessel branches are unknown, but it is unlikely that the profiles will be significantly different from parabolic for a distance of more than a radius from the junction and thus they will be unimportant in determining the flow. This is because the Reynolds numbers in the small vessels are very much less than unity and it was shown in Chapter 5 (§5.3) that the entrance length for Newtonian fluids at such Reynolds numbers is of the order of one tube diameter.